Bill Storage, Max Elfelt, Nikki Fox. Oct 23, 2026. Draft for public review.
Summary
Toms Sump is a low-airspace section of a cave passage, several hundred feet long. It is a barrier to exploration of the Droughtway region of the cave system under Droop Mountain, WV. It was first traversed in 1980 (4 trips), then revisited in 1986 (1 trip), 2024 (4 trips) and 2025 (1 trip). Other attempts from 1978 to 1981 found Toms to be closed. Scarcity of trips to the region and the absence of measurements before 2025 have prevented building even a crude hydraulic model of Toms.
Data collected in in 2025-2026 shows that Toms Sump is closed when the stream through it carries more than a threshold flow. That flow has two sources: storm water arriving through open conduits within hours, and steady drainage from slow storage in the rock above the cave. One year of logger data (Sep 2025 to Oct 2026) shows that slow storage, not summer storms, decides whether Toms stays closed.
In both 2024 and 2025 the storage was low. In 2024, storms related to Hurricane Helene dropped 7 to 9 inches of rain on the 5.11 sq mile basins that feeds Toms Sump, 100 million cubic feet of water.
The volume of the Droughtway beyond Toms was calculated as 4 million cubic feet based on survey data.
Rane Curl, in the 80s, found caves to have a fractal dimension of about 2.2. By itself, this implies caves have infinite volume, but limestone has a lower cutoff where fractal scaling stops and the micro-porosity isn’t hydraulically connected. Field work following Curl showed that a multiplier in the range of 3 to 8 should be expected.
If we multiply 4 million cubic feet based on survey by 8 for its fractal sponginess, 30 million cu ft of water would be the maximum expected volume for the region downstream of Toms. That’s a third of the calculated water volume dropped by Helene across the surface stream catchment area. Transpiration and aquifer-filling would have to handle the rest.
But twelve days later, Toms was up only about three inches. Preserved footprints from two pre-flood trips that year, water rings on mud banks, and fresh debris showed that water levels in Toms and near-sumps downstream of it had risen no more than 2 to 3 feet above pre-Helene levels. Very little of Helene’s 100 mil cu ft made it to the Drought Way.
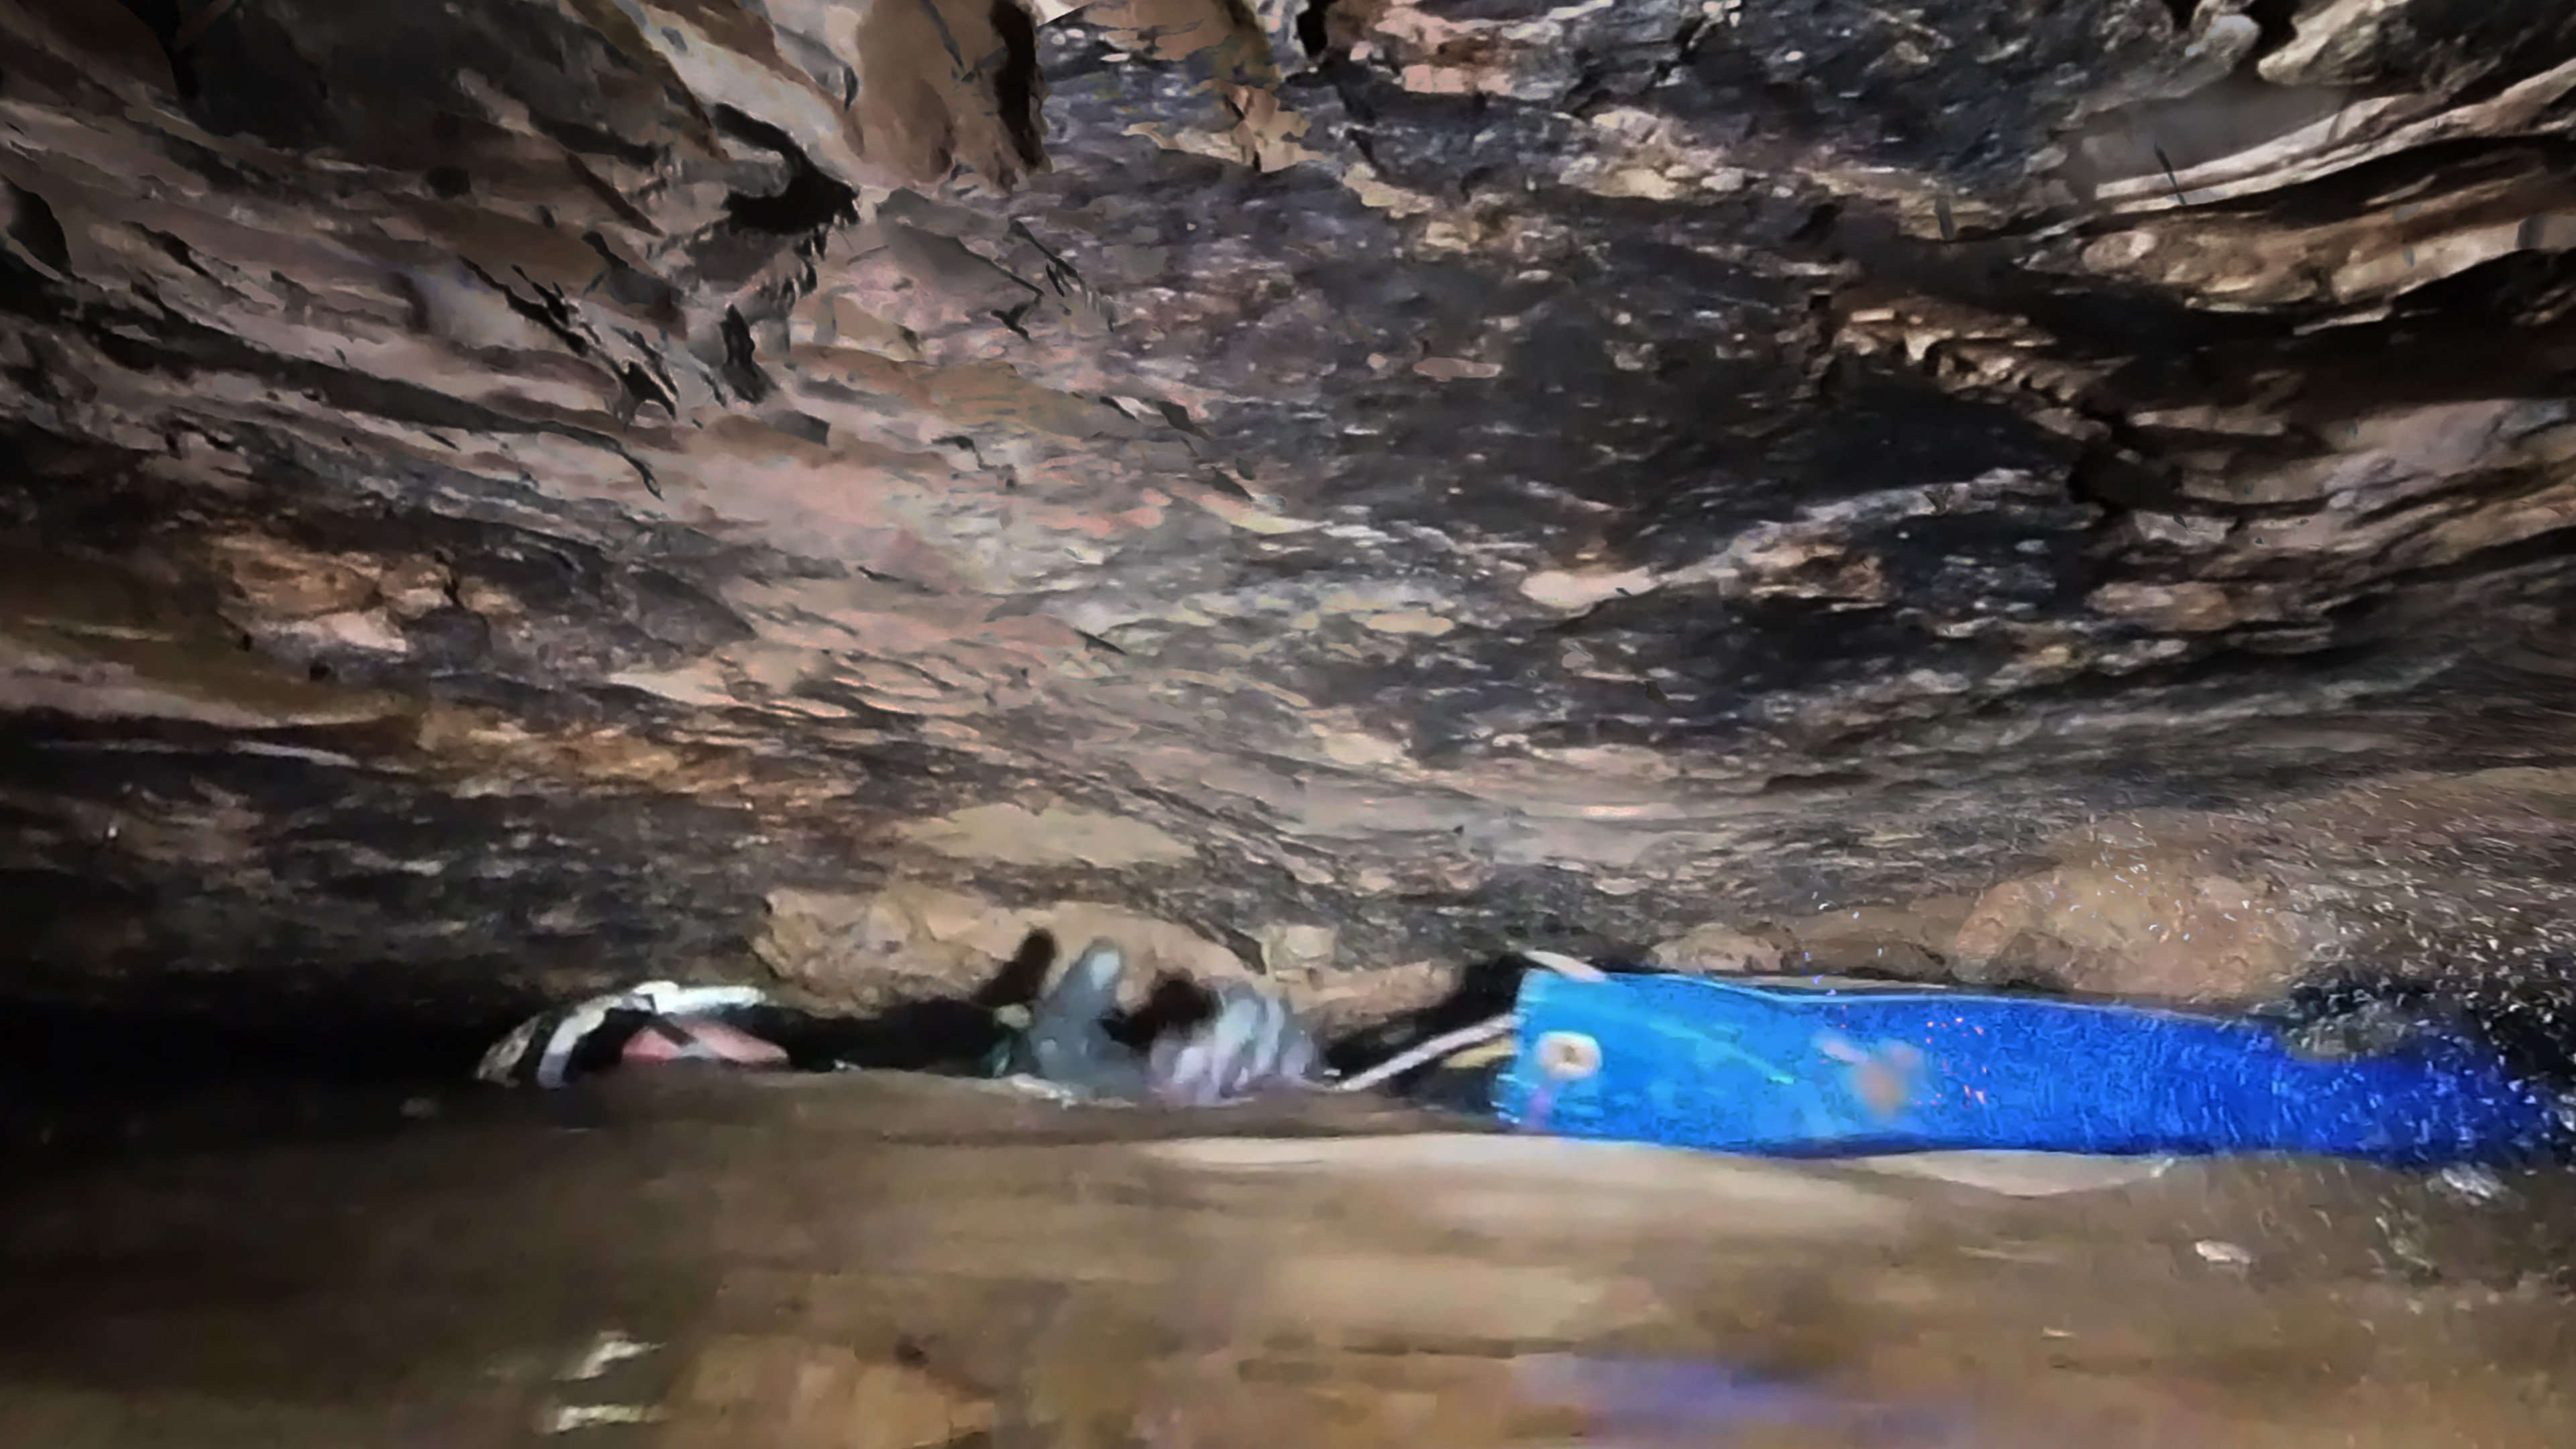
Yet we know that in some winters the Droughtway floods to a depth of at least 220 feet above the low point in the Droughtway.
Logger data shows that an October 2025 storm closed Toms for half a day, then it reopened. Subsequent storms closed it for one to six days. Once the storage filled during the low-evapotranspiration season, Toms closed on Nov 18, 2025 and stayed closed through the wet 2026 summer, including a 25-day stretch without a significant storm. A model without slow storage cannot reproduce this unless evapotranspiration is set implausibly low.
The working picture: fast conduits and the fractured Mauch Chunk carry storm water, and a slow, rate-limited store in the Alderson Limestone holds the rest. After a drought the Alderson takes weeks to months to recover, because the dry rock must take up water before recharge reaches the store. It drains through springs at its base onto the Greenville Shale, or, in some places, percolates through the Greenville Shale directly into the Union. Evapotranspiration acts as the seasonal switch. Evidence points to the Alderson as the store (see Hydrogeology).
Background
Why Toms is open or closed when it is has been debated for decades. A common view was that summer floods close it and that it might be open in winter. Previously, no continuous data on it had been recorded, and as far as we know, no one has had data of this kind anywhere in this region.
A related question is now settled. Three years ago we found clear evidence that modern debris (plastic toys) had floated to a spot 190 vertical feet above the terminal siphon. The siphon, about a mile downstream of Toms and roughly 140 feet lower, is under 2 feet in diameter. In many winters inflow exceeds what it can pass, and the cave backs up to about 70 feet above Toms. That backflooding did not happen in winter 2025–26: a logger about 30 feet above Toms stayed dry. So every closure in this record is the other kind, driven by flow through Toms itself.
Toms is a low-airspace passage that acts as a partial constriction, so its level rises with flow. It is 12000 feet from the entrance where the main stream sinks, where rock temperature is about 50 ± 1.5°F. The cave-forming Greenbrier limestones lie beneath the Mauch Chunk, which is sandstone and shale formation with thin limestone beds. The Greenville shale separates the top unit of the Greenbrier, the Alderson Limestone, and the Union and Pickaway Limestones, in which Toms Sump and its feeders lie. Shale beds, including the Greenville, hold up perched water that emerges as springs. Those springs run briefly on the surface, sometimes hidden in alluvium, and then sink again. Over the passages near Toms, though, the Greenville appears to leak (see Hydrogeology). The broad, flat top of Droop Mountain stands 500 feet above the cave entrances.
Flow into Toms Sump includes 5.11 square miles of surface basins.
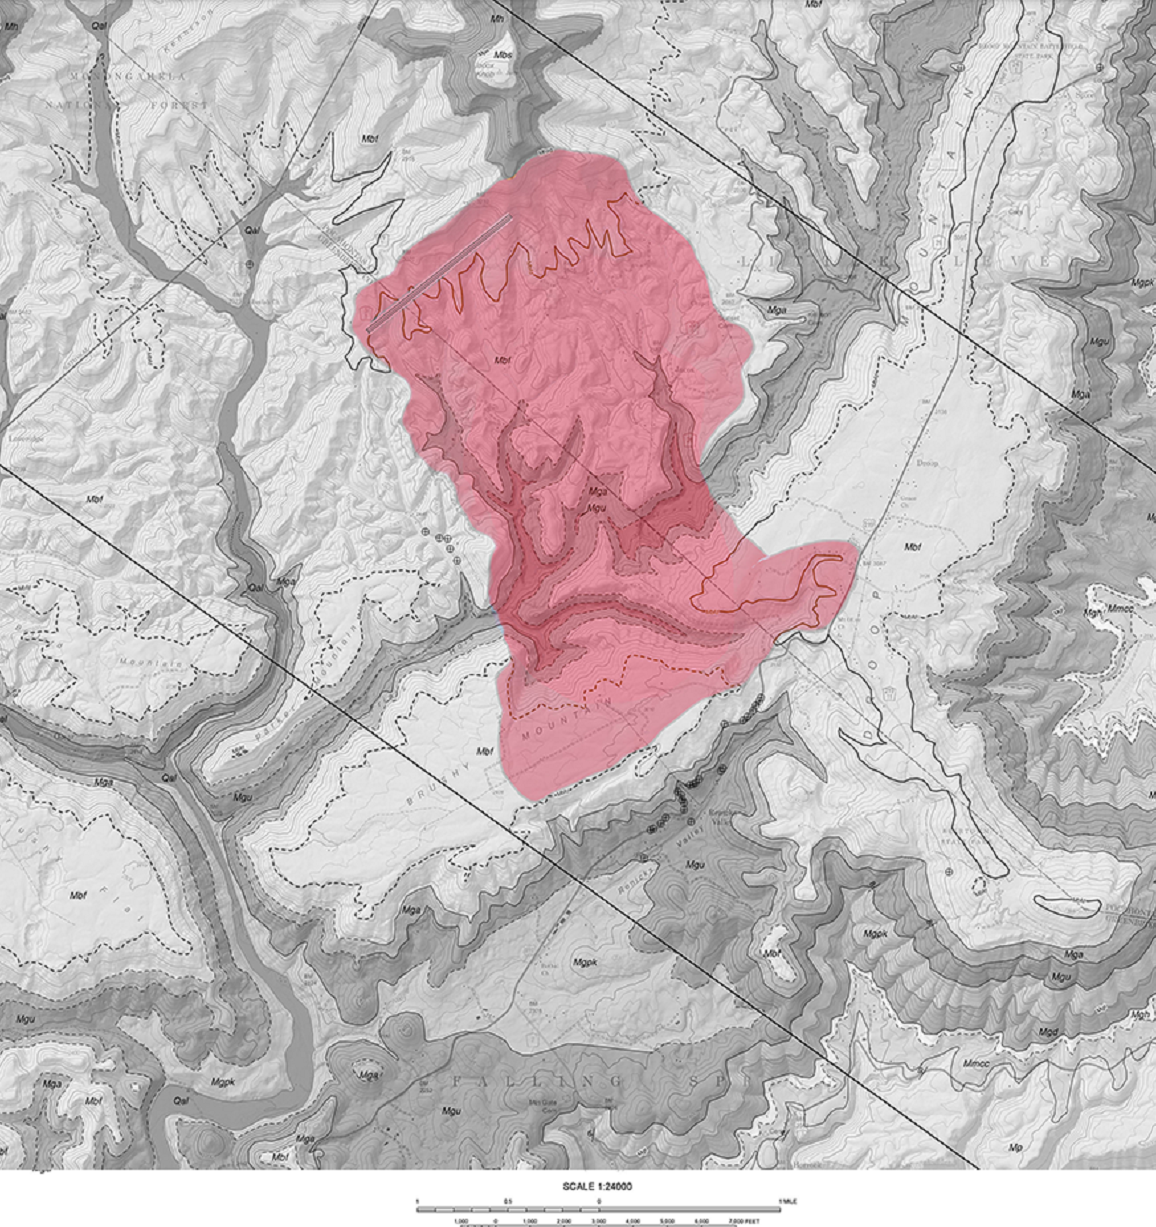
Fig.1. Toms Sump drainage area
Hydrogeology
| Unit | Thickness | Behavior | Water |
| Mauch Chunk: Droop Sandstone; Lillydale Shale and Glenray Limestone members; Reynolds Limestone | Droop 40–100 ft; Lillydale and Glenray about 250 ft combined; Reynolds 10–15 ft | Generally considered a fast-flow aquifer: high fracture permeability, rapid pressurization, minimal long-term storage. Recovers within a few days of rain after a drought | Soft |
| Alderson Limestone | Thick | Recharge lag of weeks to months. The whole column must saturate before springs at its base flow, so after a drought it takes several weeks of sustained, soaking rain to prime | Hard |
| Greenville Shale | — | Holds up the Alderson springs. Over the passages near Toms there is strong evidence it is not a significant aquitard: Mauch Chunk water percolates through the column to the streams feeding Toms | — |
Five Alderson springs. A main roadside spring is at the base of the Alderson, directly on the Greenville. It nearly dried up in the 2025 drought and did not run full again until after the February 2026 thaw, which is the priming the hydrogeologists describe. Four similar springs in the area are remarkably consistent and non-flashy. Landowners report that two have not dry in the 63 years they relied on them.
The Mauch Chunk storage is relatively small. Most springs on the slopes of flat-topped Droop Mountain dry up considerably in dry years. Use by local residents of the roadside spring is only seen in drought years.
Structure is probably the largest variable. Thrust faults can redirect flow and set how much rock drains to a given outlet in limestone and in sandstone/shale members.
What this means for the model. The slow store is the Alderson, and the linear store describes it best. Its springs drain where the Greenville crops out around Droop Mountain, so there is no sill the water must rise to before they flow. The hydrogeologists’ “column must saturate” is better read as a moisture deficit: after a drought, the dry rock above the water table must take up water before recharge reaches the store. That is a delay on the way in, not a threshold on the way out, and the model’s soil store and intake limit partly represent it. The conduit store also covers fast flow through the Mauch Chunk. The leaky Greenville gives Mauch Chunk water a direct path to Toms, which the model lumps in with its other flows.
Data
| Source | Record | What it measures | Notes |
| Toms Sump logger | Sep 11, 2025 – Sep 30, 2026 | Hourly temperature; time-stamped wet/dry (IN/OUT) events | Sensor sits at the go/no-go level, about 1 inch above low water. IN = less than 3–4 inches of airspace |
| Middle logger | Sep 2025 – Sep 2026 | Hourly temperature in cave air | Readings after retrieval (Sep 2026) excluded |
| Entrance logger | Sep 2025 – Jul 26, 2026 | Hourly temperature | Stopped early |
| Weather | Sep 11, 2025 – Sep 30, 2026 | Hourly temperature, precipitation, snowfall | Nearest available source, gridded model output rather than a gauge; likely undercounts local and high-elevation rain |
The wet/dry sensor detects water by conductivity, so very dilute water (< 100 µS/cm conductivity) can read as dry. Snowmelt streams can drop to 10 µS/cm. Brief IN/OUT flicker at each transition, lasting seconds to minutes, was merged into single events. Total precipitation over the year was 41.8 inches at the weather source.
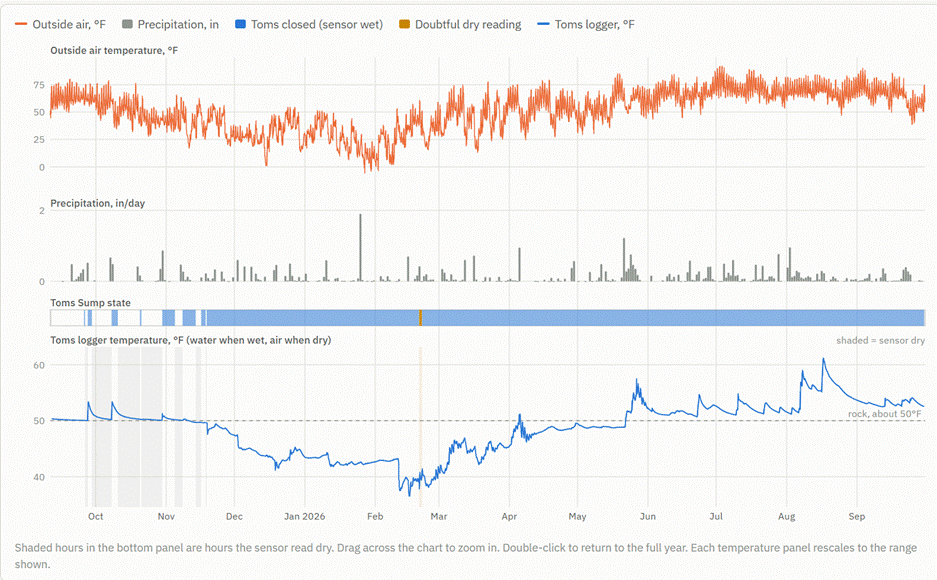
Fig. 2. Toms Sump logger and weather source · daily, Sep 11, 2025 – Sep 30, 2026
Key observations
- Closures got longer through the autumn drought, then became permanent. Storms of about 1 inch closed Toms for 2.8 days on Oct 8 but 5.6 days on Oct 30. On Nov 18, 2025, under a quarter inch of rain closed it, and it stayed closed until the logger was retrieved on Sep 30, 2026. The only break was a doubtful 30-hour dry reading on Feb 20–21, 2026.
- Toms water temperature ranged from 36.6°F to 61.2°F. We had expected a few degrees variation. The Middle logger, in cave air in the Rubber Chicken trunk, ranged only 49.1–50.8°F.
- Storm water arrives in hours. Rain-temperature water reached Toms 3–5 hours after rain began (Sep 27, 2026: rain at 09:00, water up from 50.0 to 53.4°F by 19:00). The level rose 1.5–2.5 hours before the new water arrived: the flood pushes older water ahead of it.
- Snowmelt arrives cold and fast. On Feb 10 the air reached 53°F after three weeks of subzero nights. By the evening of Feb 11, 2026, Toms had dropped from 43.2 to 37.5°F with almost no rain.
- A day/night cycle reaches Toms, but only in late winter and spring. Concern over diurnal fluctuation rose after a perceived increase in early morning water depth in October 2024. Feb–Apr shows a 0.3–0.5°F daily temperature swing, peaking 3–6 hours after the afternoon high. If an associated water level change exists, it is too small to measure. Temperature fluctuation is absent in summer. That fits surface streams feeding the sinks in the wet season, and flow from storage in summer.
- Toms stayed closed through a dry September 2026 with full evapotranspiration. Sep 1–11, 2026 had 0.65 inches of rain, no day above 0.21 inches, and highs of 80–90°F, about 25 days after the last significant storm. In fall 2025, Toms reopened within 0.5–6 days of each storm.
- An Alderson spring tracked the same storage. The road spring, at the base of the Alderson directly on the Greenville Shale, nearly dried up in the 2025 drought and did not run full again until after the February 2026 thaw.
- Large storms in a drought fall pass through quickly. In late September 2024, remnants of Hurricane Helene dropped 7 to 9 inches upstream. Toms was passable 10 days later.
The model
The model tracks water hour by hour through four stores, driven only by the weather record. Toms is predicted closed whenever the total flow reaching it exceeds a threshold.
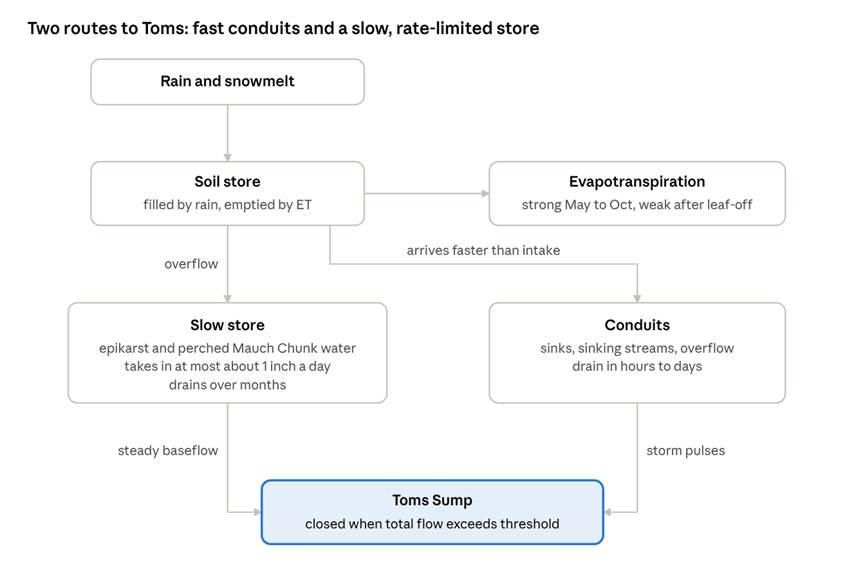
Fig. 2. Two-route model: storm water reaches Toms through the conduits in hours. Stored water supplies the steady baseflow that keeps it closed for months.
- Snowpack. Precipitation at or below 33°F accumulates as snow and melts in proportion to degrees above freezing.
- Soil. Rain and meltwater fill a soil store, and evapotranspiration (ET) draws it down. Evapotranspiration is estimated from air temperature and day length (Hamon method), scaled by a fitted crop factor and by how wet the soil is. It stops while there is snow on the ground. Water above the soil’s capacity moves on.
- Slow store (Alderson Limestone and epikarst). It accepts soil overflow only up to a maximum rate, about an inch a day in the fits; anything faster goes straight to the conduits. It drains slowly to the cave, at a rate proportional to the water it holds (a linear store). A fill-and-spill variant, which drains only above a set level, was also tested and rejected (see How it was tested).
- Conduits and fast flow. Water that the slow store rejects, anything entering sinks directly and fast fracture flow through the Mauch Chunk all pass through a fast reservoir that drains in hours to days.
Evapotranspiration is the seasonal switch. In the growing season it takes most of the rain before it reaches the slow store. After leaves fall, rain gets through and the store fills, mainly December to March in this record.
The model’s water temperature mixes the two flows: storm water carries the surface temperature, and stored water carries its own temperature. Both are pulled toward 50°F rock temperature more strongly at low flow.
How it was tested
We tested three versions of the model to the hourly IN/OUT record. The doubtful Feb 20–21 reading was left out. A no-storage version, which drops the slow store, was the competing explanation. Each version’s parameters were tuned to best match the record. Accuracy is the average of the share of closed hours and the share of open hours predicted correctly.
| Version | Accuracy | Annual ET it needs | What happens |
| No slow storage, ET free | 97.1% | 15 in (37% of rain) | Fits only with ET far below what Appalachian forests use, and with three parameters pinned at their limits |
| No slow storage, realistic ET | 91.8% | 22 in | Predicts Toms open Sep 1–13, 2026 and in late April–May. Both wrong |
| No slow storage, slow drainage allowed | 98.2% | 31 in | Picks a 29-day drainage time, so it becomes a storage model, and then misses the brief fall closures |
| Linear slow store | 98.3% | 24 in | Reproduces the fall closures and the full 2026 closure |
The two storage versions (linear and fill-and-spill) still won when rainfall was raised 25% to allow for gauge undercatch (98.2–98.5%, with ET at 55–64% of rain). The no-storage version still needed ET at 30% of rain. Temperature, which was not used in fitting, gave a weaker check: a store that delivers water at a fixed 50°F fit worst, and one that keeps a seasonal temperature for 1–3 months fit best.
The fill-and-spill version, in which the store drains only above a set level, was tested because a spring that stays dry until its reservoir fills suggests a dam: water rising to a spillway before anything flows. The data did not need it (98.4% against 98.3% for the linear store), and Droop Mountain gives it no physical basis. The aquitards and the reservoirs above them crop out all the way around the mountain, so perched water drains wherever the water table meets the slope. Nothing holds it back until a sill is reached. The linear store is the preferred model.
What it explains
| Observation | Explanation |
| Short closures in the 2025 drought fall | The Alderson was low and contributed little. Storm water passed through the conduits and the fast-draining Mauch Chunk within days |
| Closures lengthening through Oct–Nov 2025 | Leaf-off cut evapotranspiration, so rain began filling the store. Baseflow rose toward the threshold |
| Persistent closure from Nov 18, 2025 | Baseflow crossed the threshold. After that, any small storm kept Toms closed |
| Closed all summer 2026, including a dry September | The Alderson filled over the winter and drained slowly enough to hold flow above the threshold through the growing season |
| Helene, 7 inches in 2024, passable 10 days later | Intake is rate-limited. Rain that arrives faster than the store can absorb it runs off through the conduits |
| Spring dry through fall 2025, full only after the Feb thaw | The spring sits at the base of the Alderson. After the drought, the dry rock had to take up water before recharge reached the store, and the store had to recover before the spring ran full. Winter recharge did that |
| Toms closed for good on Nov 18, three months before the Alderson spring ran full | Probably a handoff. With leaves off, winter flow through the Mauch Chunk and conduits kept Toms closed while the Alderson primed. The Alderson took over the baseflow as evapotranspiration returned |
| No backflooding in winter 2025–26 | After the drought, winter inflow stayed below what the terminal siphon can pass |
| Wide temperature range, cold and warm pulses | Storm and melt water reach Toms within hours, too fast to pick up much heat from the rock |
The common view that summer floods close Toms gets the roles reversed. Summer storms in a dry year close it only briefly. What keeps it closed is a full store, and the store fills mainly in winter.
Limitations and open questions
- One year, one weather source. The weather is not from an on-site gauge. All versions miss the small closures of Sep 25 and Oct 20, 2025, probably because local rain was heavier than recorded. August storms that warmed Toms by 6–8°F registered only 0.3–0.4 inches.
- The model was fit, not predicted. Every version was tuned to this year.
- The storage drainage time is loose. The fits range from about 7 months to 2 years.
- Where the storage is. The data require slow storage. The stratigraphy, five Alderson springs and the hydrogeologists’ accounts point to the Alderson Limestone. The model has a single slow store, so it cannot separate winter flow from the Mauch Chunk from Alderson drainage. That matters because Toms closed for good on Nov 18, three months before the road spring ran full. Storage inside the cave upstream of Toms is unlikely based on the state of the cave as seen on decades of cave trips and the fast response at Toms to rains.
- How spring output depends on storage. Fill-and-spill is ruled out, but the linear store is only the simplest of the physically reasonable choices. Output could instead rise faster than in proportion to the water stored, so that a low store gives only a trickle, as at the road spring in 2025. Or it could stay roughly constant, limited by the outlet, until the store runs low, as the steady Alderson springs suggest. Toms data cannot tell these apart. A discharge record from an Alderson spring, such as the one at the Canadian Hole entrance, could.
- Structure. Small thrust faults can change how much Alderson drains to a given outlet. The Alderson upstream of (and possibly on top of) Toms may not behave like any of the springs we know.
- The Feb 20–21 2026 dry reading. It began during rain, just as a cold pulse arrived, when the model has flow rising toward a peak. A real drop in level is hard to explain. The more likely cause is very dilute water reading as dry: late snowmelt plus rain, after the first melt on Feb 11, 2026 had already flushed out most of the snowpack’s salts. Other cold, dilute pulses did not trigger it. Because air and water read the same at the sensor, temperature alone can’t prove the sensor stayed wet. But two things argue against a real drop in level:
- The temperature runs smoothly through both ends of the dry stretch.
- While the sensor read dry, the logger showed a 3°F daily melt cycle, peaking about 3 hours after a 61°F afternoon outside. Wet melt days show the same size of swing: Feb 16, Feb 27–28 and Mar 5, 2026. A swing that large means fast melt and rain water coming through, so flow was high. A cold pulse also arrived at 8 to 9 AM, an hour after the dry reading began. The level falling below the sensor during that much inflow seems highly unlikely.
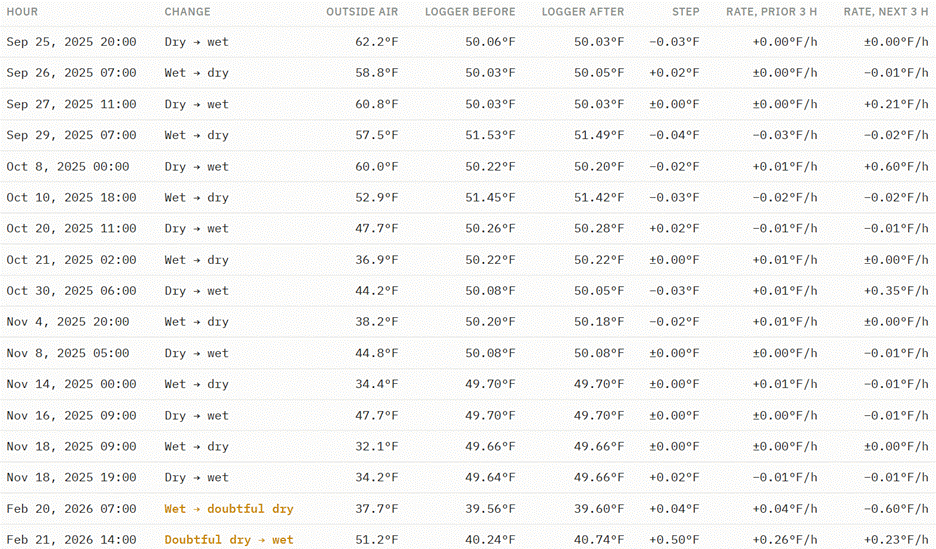
Appendix 1: Every wet/dry change, with the logger temperature around it
If air and water differed at the sensor, the temperature would have jumped in the hour the state changes. The step column is the change across that hour; the next two columns show the trend just before and after, for scale.