Posts Tagged covid-19
Bad Science, Broken Trust: Commentary on Pandemic Failure
Posted by Bill Storage in History of Science on May 20, 2025
In my three previous posts (1, 2, 3) on the Covid-19 response and statistical reasoning, I deliberately sidestepped a deeper, more uncomfortable truth that emerges from such analysis: that ideologically driven academic and institutional experts – credentialed, celebrated, and deeply embedded in systems of authority – played a central role in promoting flawed statistical narratives that served political agendas and personal advancement. Having defended my claims in two previous posts – from the perspective of a historian of science – I now feel I justified in letting it rip. Bad science, bad statistics, and institutional arrogance directly shaped a public health disaster.
What we witnessed was not just error, but hubris weaponized by institutions. Self-serving ideologues – cloaked in the language of science – shaped policies that led, in no small part, to hundreds of thousands of preventable deaths. This was not a failure of data, but of science and integrity, and it demands a historical reckoning.
The Covid-19 pandemic exacted a devastating toll: a 13% global GDP collapse in Q2 2020, and a 12–15% spike in adolescent suicidal ideation, as reported by Nature Human Behaviour (2020) and JAMA Pediatrics (2021). These catastrophic outcomes –economic freefall and a mental health crisis – can’t be blamed on the pathogen. Its lethality was magnified by avoidable policy blunders rooted in statistical incompetence and institutional cowardice. Five years on, the silence from public health authorities is deafening. The opportunity to learn from these failures – and to prevent their repetition – is being squandered before our eyes.
One of the most glaring missteps was the uncritical use of raw case counts to steer public policy – a volatile metric, heavily distorted by shifting testing rates, as The Lancet (2021, cited earlier) highlighted. More robust measures like deaths per capita or infection fatality rates, advocated by Ioannidis (2020), were sidelined, seemingly for facile politics. The result: fear-driven lockdowns based on ephemeral, tangential data. The infamous “6-foot rule,” based on outdated droplet models, continued to dominate public messaging through 2020 and beyond – even though evidence (e.g., BMJ, 2021) solidly pointed to airborne transmission. This refusal to pivot toward reality delayed life-saving ventilation reforms and needlessly prolonged school closures, economic shutdowns, and the cascading psychological harm they inflicted.
At the risk of veering into anecdote, this example should not be lost to history: In 2020, a surfer was arrested off Malibu Beach and charged with violating the state’s stay-at-home order. As if he might catch or transmit Covid – alone, in the open air, on the windswept Pacific. No individual could possibly believe that posed a threat. It takes a society – its institutions, its culture, its politics – to manufacture collective stupidity on that scale.
The consequences of these reasoning failures were grave. And yet, astonishingly, there has been no comprehensive, transparent institutional reckoning. No systematic audits. No revised models. No meaningful reforms from the CDC, WHO, or major national agencies. Instead, we see a retrenchment: the same narratives, the same faces, and the same smug complacency. The refusal to account for aerosol dynamics, mental health trade-offs, or real-time data continues to compromise our preparedness for future crises. This is not just negligence. It is a betrayal of public trust.
If the past is not confronted, it will be repeated. We can’t afford another round of data-blind panic, policy overreach, and avoidable harm. What’s needed now is not just reflection but action: independent audits of pandemic responses, recalibrated risk models that incorporate full-spectrum health and social impacts, and a ruthless commitment to sound use of data over doctrine.
The suffering of 2020–2022 must mean something. If we want resilience next time, we must demand accountability this time. The era of unexamined expert authority must end – not to reject expertise – but to restore it to a foundation of integrity, humility, and empirical rigor.
It’s time to stop forgetting – and start building a public health framework worthy of the public it is supposed to serve.
___ ___ ___

Covid Response – Case Counts and Failures of Statistical Reasoning
Posted by Bill Storage in History of Science on May 19, 2025
In my previous post I defended three claims made in an earlier post about relative successes in statistics and statistical reasoning in the American Covid-19 response. This post gives support for three claims regarding misuse of statistics and poor statistical reasoning during the pandemic.
Misinterpretation of Test Results (4)
Early in the COVID-19 pandemic, many clinicians and media figures misunderstood diagnostic test accuracy, misreading PCR and antigen test results by overlooking pre-test probability. This caused false reassurance or unwarranted alarm, though some experts mitigated errors with Bayesian reasoning. This was precisely the type of mistake highlighted in the Harvard study decades earlier. (4)
Polymerase chain reaction (PCR) tests, while considered the gold standard for detecting SARS-CoV-2, were known to have variable sensitivity (70–90%) depending on factors like sample quality, timing of testing relative to infection, and viral load. False negatives were a significant concern, particularly when clinicians or media interpreted a negative result as definitively ruling out infection without considering pre-test probability (the likelihood of disease based on symptoms, exposure, or prevalence). Similarly, antigen tests, which are less sensitive than PCR, were prone to false negatives, especially in low-prevalence settings or early/late stages of infection.
A 2020 article in Journal of General Internal Medicine noted that physicians often placed undue confidence in test results, minimizing clinical reasoning (e.g., pre-test probability) and deferring to imperfect tests. This was particularly problematic for PCR false negatives, which could lead to a false sense of security about infectivity.
A 2020 Nature Reviews Microbiology article reported that during the early pandemic, the rapid development of diagnostic tests led to implementation challenges, including misinterpretation of results due to insufficient consideration of pre-test probability. This was compounded by the lack of clinical validation for many tests at the time.
Media reports often oversimplified test results, presenting PCR or antigen tests as definitive without discussing limitations like sensitivity, specificity, or the role of pre-test probability. Even medical professionals struggled with Bayesian reasoning, leading to public confusion about test reliability.
Antigen tests, such as lateral flow tests, were less sensitive than PCR (pooled sensitivity of 64.2% in pediatric populations) but highly specific (99.1%). Their performance varied significantly with pre-test probability, yet early in the pandemic, they were sometimes used inappropriately in low-prevalence settings, leading to misinterpretations. In low-prevalence settings (e.g., 1% disease prevalence), a positive antigen test with 99% specificity and 64% sensitivity could have a high false-positive rate, but media and some clinicians often reported positives as conclusive without contextualizing prevalence. Conversely, negative antigen tests were sometimes taken as proof of non-infectivity, despite high false-negative rates in early infection.
False negatives in PCR tests were a significant issue, particularly when testing was done too early or late in the infection cycle. A 2020 study in Annals of Internal Medicine found that the false-negative rate of PCR tests varied by time since exposure, peaking at 20–67% depending on the day of testing. Clinicians who relied solely on a negative PCR result without considering symptoms or exposure history often reassured patients they were not infected, potentially allowing transmission.
In low-prevalence settings, even highly specific tests like PCR (specificity ~99%) could produce false positives, especially with high cycle threshold (Ct) values indicating low viral loads. A 2020 study in Clinical Infectious Diseases found that only 15.6% of positive PCR results in low pre-test probability groups (e.g., asymptomatic screening) were confirmed by an alternate assay, suggesting a high false-positive rate. Media amplification of positive cases without context fueled public alarm, particularly during mass testing campaigns.
Antigen tests, while rapid, had lower sensitivity and were prone to false positives in low-prevalence settings. An oddly credible 2021 Guardian article noted that at a prevalence of 0.3% (1 in 340), a lateral flow test with 99.9% specificity could still yield a 5% false-positive rate among positives, causing unnecessary isolation or panic. In early 2020, widespread testing of asymptomatic individuals in low-prevalence areas led to false positives being reported as “new cases,” inflating perceived risk.
Many Covid professionals mitigated errors with Bayesian reasoning, using pre-test probability, test sensitivity, and specificity to calculate the post-test probability of disease. Experts who applied this approach were better equipped to interpret COVID-19 test results accurately, avoiding over-reliance on binary positive/negative outcomes.
Robert Wachter, MD, in a 2020 Medium article, explained Bayesian reasoning for COVID-19 testing, stressing that test results must be interpreted with pre-test probability. For example, a negative PCR in a patient with a 30% pre-test probability (based on symptoms and prevalence) still carried a significant risk of infection, guiding better clinical decisions. In Germany, mathematical models incorporating pre-test probability optimized PCR allocation, ensuring testing was targeted to high-risk groups.
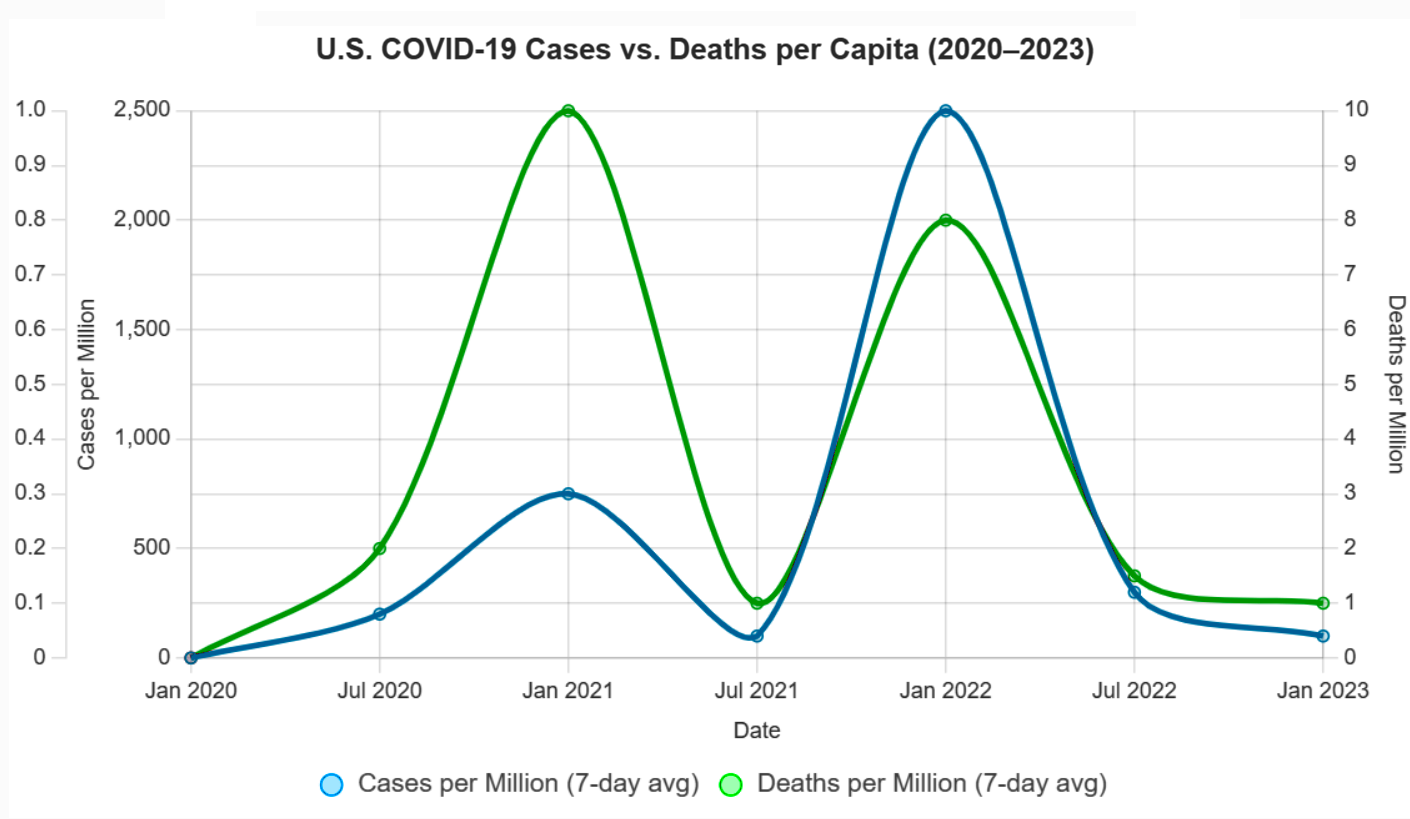
Cases vs. Deaths (5)
One of the most persistent statistical missteps during the pandemic was the policy focus on case counts, devoid of context. Case numbers ballooned or dipped not only due to viral spread but due to shifts in testing volume, availability, and policies. Covid deaths per capita rather than case count would have served as a more stable measure of public health impact. Infection fatality rates would have been better still.
There was a persistent policy emphasis on cases alone. Throughout the COVID-19 pandemic, public health policies, such as lockdowns, mask mandates, and school closures, were often justified by rising case counts reported by agencies like the CDC, WHO, and national health departments. For example, in March 2020, the WHO’s situation reports emphasized confirmed cases as a primary metric, influencing global policy responses. In the U.S., states like California and New York tied reopening plans to case thresholds (e.g., California’s Blueprint for a Safer Economy, August 2020), prioritizing case numbers over other metrics. Over-reliance on case-based metrics was documented by Trisha Greenhalgh in Lancet (Ten scientific reasons in support of airborne transmission…).
Case counts, without context, were frequently reported without contextualizing factors like testing rates or demographics, leading to misinterpretations. A 2021 BMJ article criticized the overreliance on case counts, noting they were used to “justify public health measures” despite their variability, supporting the claim of a statistical misstep. Media headlines, such as “U.S. Surpasses 100,000 Daily Cases” (CNN, November 4, 2020), amplified case counts, often without clarifying testing changes, fostering fear-driven policy decisions.
Case counts were directly tied to testing volume, which varied widely. In the U.S., testing increased from ~100,000 daily tests in April 2020 to over 2 million by November 2020 (CDC data). Surges in cases often coincided with testing ramps, e.g., the U.S. case peak in July 2020 followed expanded testing in Florida and Texas. Testing access was biased (in the statistical sense). Widespread testing including asymptomatic screening inflated counts. Policies like mandatory testing for hospital admissions or travel (e.g., New York’s travel testing mandate, November 2020) further skewed numbers. 2020 Nature study highlighted that case counts were “heavily influenced by testing capacity,” with countries like South Korea detecting more cases due to aggressive testing, not necessarily higher spread. This supports the claim that testing volume drove case fluctuations beyond viral spread (J Peto, Nature – 2020).
Early in the pandemic, testing was limited due to supply chain issues and regulatory delays. For example, in March 2020, the U.S. conducted fewer than 10,000 tests daily due to shortages of reagents and swabs, underreporting cases (Johns Hopkins data). This artificially suppressed case counts. A 2021 Lancet article (R Horton) noted that “changes in testing availability distorted case trends,” with low availability early on masking true spread and later increases detecting more asymptomatic cases, aligning with the claim.
Testing policies, such as screening asymptomatic populations or requiring tests for specific activities, directly impacted case counts. For example, in China, mass testing of entire cities like Wuhan in May 2020 identified thousands of cases, many asymptomatic, inflating counts. In contrast, restrictive policies early on (e.g., U.S. CDC’s initial criteria limiting tests to symptomatic travelers, February 2020) suppressed case detection.
In the U.S., college campuses implementing mandatory weekly testing in fall 2020 reported case spikes, often driven by asymptomatic positives (e.g., University of Wisconsin’s 3,000+ cases, September 2020). A 2020 Science study (Assessment of SARS-CoV-2 screening) emphasized that “testing policy changes, such as expanded screening, directly alter reported case numbers,” supporting the claim that policy shifts drove case variability.
Deaths per capita, calculated as total Covid-19 deaths divided by population, are less sensitive to testing variations than case counts. For example, Sweden’s deaths per capita (1,437 per million by December 2020, Our World in Data) provided a clearer picture of impact than its case counts, which fluctuated with testing policies. Belgium and the U.K. used deaths per capita to compare regional impacts, guiding resource allocation. A 2021 JAMA study argued deaths per capita were a “more reliable indicator” of pandemic severity, as they reflected severe outcomes less influenced by testing artifacts. Death reporting had gross inconsistencies (e.g., defining “Covid-19 death”), but it was more standardized than case detection.
Infection Fatality Rates (IFR) reports the proportion of infections resulting in death, making it less prone to testing biases. A 2020 Bulletin of the WHO meta-analysis estimated a global IFR of ~0.6% (range 0.3-1.0%), varying by age and region. IFR gave a truer measure of lethality. Seroprevalence studies in New York City (April 2020) estimated an IFR of ~0.7%, offering insight into true mortality risk compared to case fatality rates (CFR), which were inflated by low testing (e.g., CFR ~6% in the U.S., March 2020).
Shifting Guidelines and Aerosol Transmission (6)
The “6-foot rule” was based on outdated models of droplet transmission. When evidence of aerosol spread emerged, guidance failed to adapt. Critics pointed out the statistical conservatism in risk modeling, its impact on mental health and the economy. Institutional inertia and politics prevented vital course corrections.
The 6-foot (or 2-meter) social distancing guideline, widely adopted by the CDC and WHO in early 2020, stemmed from historical models of respiratory disease transmission, particularly the 1930s work of William F. Wells on tuberculosis. Wells’ droplet model posited that large respiratory droplets fall within 1–2 meters, implying that maintaining this distance reduces transmission risk. The CDC’s March 2020 guidance explicitly recommended “at least 6 feet” based on this model, assuming most SARS-CoV-2 transmission occurred via droplets.
The droplet model was developed before modern understanding of aerosol dynamics. It assumed that only large droplets (>100 μm) were significant, ignoring smaller aerosols (<5–10 μm) that can travel farther and remain airborne longer. A 2020 Nature article noted that the 6-foot rule was rooted in “decades-old assumptions” about droplet size, which did not account for SARS-CoV-2’s aerosol properties, such as its ability to spread in poorly ventilated spaces beyond 6 feet.
Studies, like a 2020 Lancet article by Morawska and Milton, argued that the 6-foot rule was inadequate for aerosolized viruses, as aerosols could travel tens of meters in certain conditions (e.g., indoor settings with low air exchange). Real-world examples, such as choir outbreaks (e.g., Skagit Valley, March 2020, where 53 of 61 singers were infected despite spacing), highlighted transmission beyond 6 feet, undermining the droplet-only model.
The WHO initially downplayed aerosol transmission, stating in March 2020 that COVID-19 was “not airborne” except in specific medical procedures (e.g., intubation). After the July 2020 letter, the WHO updated its guidance on July 9, 2020, to acknowledge “emerging evidence” of airborne spread but maintained droplet-focused measures (e.g., 1-meter distancing) without emphasizing ventilation or masks for aerosols. A 2021 BMJ article criticized the WHO for “slow and risk-averse” updates, noting that full acknowledgment of aerosol spread was delayed until May 2021.
The CDC also failed to update its guidance. In May 2020, it emphasized droplet transmission and 6-foot distancing. A brief September 2020 update mentioning “small particles” was retracted days later, reportedly due to internal disagreement. The CDC fully updated its guidance to include aerosol transmission in May 2021, recommending improved ventilation, but retained the 6-foot rule in many contexts (e.g., schools) until 2022. Despite aerosol evidence, the 6-foot rule remained a cornerstone of policies. For example, U.S. schools enforced 6-foot desk spacing in 2020–2021, delaying reopenings despite studies (e.g., a 2021 Clinical Infectious Diseases study).
Early CDC and WHO models overestimated droplet transmission risks while underestimating aerosol spread, leading to rigid distancing rules. A 2021 PNAS article by Prather et al. criticized these models as “overly conservative,” noting they ignored aerosol physics and real-world data showing low outdoor transmission risks. Risk models overemphasized close-contact droplet spread, neglecting long-range aerosol risks in indoor settings. John Ioannidis, in a 2020 European Journal of Clinical Investigation commentary, criticized the “precautionary principle” in modeling, which prioritized avoiding any risk over data-driven adjustments, leading to policies like prolonged school closures based on conservative assumptions about transmission.
Risk models rarely incorporated Bayesian updates with new data, specifically low transmission in well-ventilated spaces. A 2020 Nature commentary by Tang et al. noted that models failed to adjust for aerosol decay rates or ventilation, overestimating risks in outdoor settings while underestimating them indoors.
Researchers and public figures criticized prolonged social distancing and lockdowns, driven by conservative risk models, for exacerbating mental health issues. A 2021 The Lancet Psychiatry study reported a 25% global increase in anxiety and depression in 2020, attributing it to isolation from distancing measures. Jay Bhattacharya, co-author of the Great Barrington Declaration, argued in 2020 that rigid distancing rules, like the 6-foot mandate, contributed to social isolation without proportional benefits.
Tragically, A 2021 JAMA Pediatrics study concluded that Covid school closures increased adolescent suicide ideation by 12–15%. Economists and policy analysts, such as those at the American Institute for Economic Research (AIER), criticized the economic fallout of distancing policies. The 6-foot rule led to capacity restrictions in businesses (e.g., restaurants, retail), contributing to economic losses. A 2020 Nature Human Behaviour study estimated a 13% global GDP decline in Q2 2020 due to lockdowns and distancing measures.
Institutional inertia and political agendas prevented course corrections, such as prioritizing ventilation over rigid distancing. The WHO’s delay in acknowledging aerosols was attributed to political sensitivities. A 2020 Nature article (Lewis) reported that WHO advisors faced pressure to align with member states’ policies, slowing updates.
Next post, I’ll offer commentary on Covid policy from the perspective of a historian of science.
Covid Response – Signs of Statistical Success
Posted by Bill Storage in History of Science, Philosophy of Science on May 18, 2025
In a recent post, I suggested that the Covid response demonstrated success in several areas of statistical reasoning, including clear communication of mRNA vaccine efficacy, data-driven ICU triage using the SOFA score, and the use of wastewater epidemiology. The following points support this claim.
Risk Communication in Vaccine Trials (1)
The early mRNA vaccine announcements in 2020 offered clear statistical framing by emphasizing a 95% relative risk reduction in symptomatic Covid for vaccinated individuals compared to placebo, sidelining raw case counts for a punchy headline. While clearer than many public health campaigns, this focus omitted absolute risk reduction and uncertainties about asymptomatic spread, falling short of the full precision needed to avoid misinterpretation.
Pfizer/BioNTech’s November 18, 2020, press release announced a 95% efficacy for its mRNA vaccine (BNT162b2) in preventing symptomatic Covid-19, based on 170 cases (162 in the placebo group, 8 in the vaccinated group) in a trial of ~43,538 participants. Moderna’s November 16, 2020, press release reported a 94.5% efficacy for its mRNA vaccine (mRNA-1273), based on 95 cases (90 placebo, 5 vaccinated) in a 30,000-participant trial. Both highlighted relative risk reduction (RRR) as the primary metric. For Pfizer, placebo risk was ~0.88% (162/18,325), vaccinated risk was ~0.04% (8/18,198), yielding ~95% RRR.

The focus omitted absolute risk reduction (ARR), as described by Brown in Outcome Reporting Bias in COVID mRNA Vaccine Clinical Trials. ARR is the difference in event rates between placebo and vaccinated groups. For Pfizer, placebo risk was ~0.88% (162/18,325), vaccinated risk was ~0.04% (8/18,198), giving an ARR of ~0.84%. Moderna’s ARR was ~0.6% (90/15,000 = 0.6% placebo risk, 5/15,000 = 0.03% vaccinated risk). Neither Pfizer’s nor Moderna’s November 2020 press releases mentioned ARR, focusing solely on RRR. The NEJM publications (Polack, 2020; Baden, 2021) reported RRR and case counts but not ARR explicitly. Both CDC and WHO messaging in 2020 emphasized efficacy rates, not ARR (e.g., CDC’s “Vaccine Effectiveness,” December 2020).
The focus omitted uncertainties about asymptomatic spread, as described by Oran & Topol Prevalence of Asymptomatic SARS-CoV-2 Infection (2020). Pfizer and Moderna trials primarily measured efficacy against symptomatic Covid, with no systematic testing for asymptomatic infections in initial protocols. Pfizer later included N-antibody testing for a subset, but this was not reported in November 2020. Studies (e.g., Oran & Topol, 2020) estimated 40-50% of infections were asymptomatic, but vaccine effects on this were unknown. A CDC report (December 2020) noted uncertainty about transmission.
While generally positive, framing fell short of the precision needed to avoid misinterpretation. The RRR focus without ARR or baseline risk context could exaggerate benefits. High-visibility figures like Bill Gates amplified vaccine optimism, fostering overconfidence in transmission control. For Pfizer, a 95% RRR contrasted with a 0.84% ARR, which was less emphasized. The lack of clarity about transmission led to public misconceptions, with surveys (e.g., Kaiser Family Foundation, January 2021) showing that many people believed vaccines would prevent transmission.
Clinical Triage via Quantitative Models (2)
During peak ICU shortages, hospitals adopted the SOFA score, originally a tool for assessing organ dysfunction, to guide resource allocation with a semi-objective, data-driven approach. While an improvement over ad hoc clinical judgment, SOFA faced challenges like inconsistent application and biases that disadvantaged older or chronically ill patients, limiting its ability to achieve fully equitable triage.
The SOFA score, developed to assess organ dysfunction in critically ill patients, was widely adopted during the Covid pandemic to guide ICU triage and resource allocation in hospitals facing overwhelming demand. Studies and guidelines from 2020–2022 document its use.
Several articles described the incorporation of SOFA scores were incorporated into triage protocols in hospitals in New York, Italy, and Spain to prioritize patients for ventilators and ICU beds, e.g., Fair allocation of scarce medical resources in the time of Covid (NEJM), Adult ICU triage during the Covid pandemic (Lancet), and A framework for rationing ventilators… (Critical Care Medicine).
A 2022 study in Critical Care reported variability in how SOFA was implemented, with some hospitals modifying the scoring criteria or weighting certain organ systems differently, leading to discrepancies in patient prioritization (Maves, 2022). A 2021 analysis in BMJ Open found that SOFA’s application varied due to differences in clinician training, data availability (e.g., incomplete lab results), and local protocol adaptations, which undermined its reliability in some settings (Cook, 2021).
Still, the SOFA score’s design and application introduced biases that disproportionately disadvantaged older adults and patients with chronic illnesses. A 2020 study in The Lancet pointed out that SOFA scores often penalize patients with pre-existing organ dysfunction, as baseline comorbidities (common in older or chronically ill patients) result in higher scores, suggesting worse outcomes even if acute illness was treatable (Grasselli, 2020). A 2021 article in JAMA Internal Medicine criticized SOFA-based triage for its lack of adjustment for age or chronic conditions, noting that older patients were frequently deprioritized due to higher baseline SOFA scores, even when their acute prognosis was favorable (Wunsch, 2021).
Wastewater Epidemiology (3)
Public health researchers used viral RNA in wastewater to monitor community spread, reducing the sampling biases of clinical testing. This statistical surveillance, conducted outside clinics, offered high public health relevance but faced biases and interpretive challenges that tempered its precision.
Wastewater-based epidemiology (WBE) emerged as a critical tool during the Covid pandemic to monitor SARS-CoV-2 RNA in wastewater, providing a population-level snapshot of viral prevalence. Infected individuals, including symptomatic, asymptomatic, and presymptomatic cases, shed viral RNA in their feces, which is detectable in wastewater, enabling community-wide surveillance.
The Centers for Disease Control and Prevention (CDC) launched the National Wastewater Surveillance System (NWSS) in September 2020 to coordinate tracking of SARS-CoV-2 in wastewater across the U.S., transforming local efforts into a national system. A 2020 study in Nature Biotechnology demonstrated that SARS-CoV-2 RNA concentrations in primary sewage sludge in New Haven, Connecticut, tracked the rise and fall of clinical cases and hospital admissions, confirming WBE’s ability to monitor community spread. Similarly, a 2021 study in Scientific Reports monitored SARS-CoV-2 RNA in wastewater from Frankfurt, Germany, showing correlations with reported cases.
Globally, WBE was applied in countries like India, Australia, and the Netherlands, with a 2021 systematic review in ScienceDirect reporting SARS-CoV-2 detection in 29.2% of 26,197 wastewater samples across 34 countries. These studies highlight WBE’s scalability but also underscore challenges in standardizing methods across diverse settings, which could affect data reliability.
Clinical testing for SARS-CoV-2 exposed biases, including selective sampling, testing fatigue, and underreporting from home-based rapid tests. WBE mitigates these by capturing viral RNA from entire communities, including asymptomatic and untested individuals. A 2021 article in Clinical Microbiology Reviews noted that WBE avoids selective population sampling biases, as it does not depend on individuals seeking testing or healthcare access. Daily wastewater sampling provides data comparable to random testing of hundreds of individuals, but is more cost-effective and less invasive.
In practice, WBE’s ability to detect viral RNA in wastewater from diverse populations was demonstrated in settings like university dormitories, where early detection prompted targeted clinical testing.
Next time, I’ll explain why I believe several other aspects of statistical reasoning in the Covid response were poorly handled, some even deeply flawed.
