Archive for category Probability and Risk
Intuitive Probabilities – Conjunction Malfunction
Posted by Bill Storage in Aerospace, Probability and Risk, Systems Engineering on October 15, 2013
In a recent post I wrote about Vic, who might not look like a Christian, but probably is one. The Vic example reminded me of a famous study of unintuitive probabilities done in 1983. Amos Tversky and Daniel Kahneman surveyed students at the University of British Columbia using something similar to my Vic puzzle:
Linda is 31 years old, single, outspoken, and very bright. She majored in philosophy. As a student, she was deeply concerned with issues of discrimination and social justice, and also participated in anti-nuclear demonstrations.
Which is more probable?
A. Linda is a bank teller.
B. Linda is a bank teller and is active in the feminist movement.
 About 90% of students said (B) was more probable. Mathematicians point out that, without needing to know anything about Linda, (A) has to be more probable than (B). Thinking otherwise is the conjunction fallacy. It’s simple arithmetic. The probability of a conjunction, P(A&B), cannot exceed the probabilities of its constituents, P(A) and P(B), because the extension (possibility set) of the conjunction is included in the extension of its constituents. In a coin toss, the probability of heads has to exceed the probability of heads AND that it will rain today.
Putting numbers to Linda, one might guess there’s 1% probability that Linda, based on the description given, is a bank teller, but a 99% probability that she’s a feminist. Even so, 1% is still a bigger number (probability) than 1% AND 99%, which means 1% times 99% – which is a tad less than 1%.
So why does it seem like (B) is more likely? Lots of psychological and semantic reasons have been proposed. For example, in normal communications, we usually obey some unspoken principle of relevance; a sane person would not mention Linda’s marital status, political views and values if they were irrelevant to the question at hand – which somehow seems to have something to do with Linda’s profession. Further, humans learn pattern recognition and apply heuristics. It may be a fair bit of inductive reasoning based on past evidence that women active in the feminist movement are more likely than those who are not to major in philosophy, be single, and be concerned with discrimination. This may be a reasonable inference, or it may just prove you’re a sexist pig for even thinking such a thing. I attended a lecture at UC Berkeley where I was told that any statement by men that connects attributes (physical, ideological or otherwise) to any group (except white men) constituted sexism, racism or some otherism. This made me wonder how feminists are able to recognize other feminists.
In any case, there are reasons that student would not give the mathematically correct answer about Linda beyond the possibility that they are mathematically illiterate. Tversky and Kahneman tried various wordings of the problem, pretty much getting the same results. At some point they came up with this statement of the problem that seems to drive home the point that they were seeking a mathematical interpretation of the problem:
Argument 1: Linda is more likely to be a bank teller than she is to be a feminist bank teller, because every feminist bank teller is a bank teller, but some bank tellers are not feminists, and Linda could be one of them.
Argument 2: Linda is more likely to be a feminists bank teller than she is likely to be a bank teller, because she resembles an active feminist more than she resembles a bank teller.
In this case 65% of students chose the extension argument (2), despite its internal logical flaw. Note that argument 1 explains why the conjunction fallacy is invalid and that argument 2 doesn’t really make much sense.
Whatever the reason we tend to botch such probability challenges, there are cases in engineering that are surprisingly analogous to the Linda problem. For example, when building a fault tree (see fig. 1), your heuristics can make you miss event dependencies and common causes between related failures. For example, if an aircraft hydraulic brake system accumulator fails by exploding instead of by leaking, and in doing so severs a hydraulic line, an “AND” relationship disappears so that what appeared to be P(A&B) becomes simply P(A). Such logic errors can make calculations of probability of catastrophe off by factors of thousands or millions. This is bad, when lives are at stake. Fortunately, engineers apply great skill and discipline to modeling this sort of thing. We who fly owe our lives to good engineers. Linda probably does too.
Fig. 1. Segment of a fault tree for loss of braking in a hypothetical 8-wheeled aircraft using FTA software I authored in 1997. This fault tree addresses only a single Class IV hazard in aircraft braking – uncontrolled departure from the end of the runway due to loss of braking during a rejected takeoff. It calculates the probability of this “top event” as being more remote than the one-per-billion flight hours probability limit specified by the guidelines of FAA Advisory Circular 25.1309-1A, 14CFR/CS 25.1309, and SAE ARP4754. This fault tree, when simplified by standard techniques, results in about 200,000 unique cut sets – combinations of basic events leading to the catastrophic condition.

– – –
Uncertainty is an unavoidable aspect of the human condition- Opening sentence of “Extensional Versus Intuitive Reasoning” by Tversky and Kahneman, Oct. 1983 Psychological Review.
Intuitive Probabilities
Posted by Bill Storage in Probability and Risk on October 1, 2013
 Meet Vic. Vic enjoys a form of music that features heavily distorted guitars, slow growling vocals, atonality, frequent tempo changes, and what is called “blast beat” drumming in the music business. His favorite death metal bands are Slayer, Leviticus, Dark Tranquility, Arch Enemy, Behemoth, Kreator, Venom, and Necrophagist.
Vic has strong views on theology and cosmology. Which is more likely?
- Vic is a Christian
- Vic is a Satanist
I’ve taught courses on probabilistic risk analysis over the years, and have found that very intelligent engineers, much more experienced than I, often find probability extremely unintuitive. Especially when very large (or very small) numbers are involved. Other aspects of probability and statistics are unintuitive for other interesting reasons. More on those later.
The matter of Vic’s belief system involves several possible biases and unintuitive aspects of statistics. While pondering the issue of Vic’s beliefs, you can enjoy Slayer’s Raining Blood. Then check out my take on judging Vic’s beliefs below the embedded YouTube video – which, by the way, demonstrates all of the attributes of death metal listed above.
.
Vic is almost certainly a Christian. Any other conclusion would involve the so-called base-rate fallacy, where the secondary, specific facts (affinity for death metal) somehow obscure the primary, base-rate relative frequency of Christians versus Satanists. The Vatican claims over one billion Catholics, and most US Christians are not Catholic. Even with papal exaggeration, we can guess that there are well over a billion Christians on earth. I know hundreds if not thousands of them. I don’t know any Satanists personally, and don’t know of any public figures who are (there is conflicting evidence on Marilyn Manson). A quick Google search suggests a range of numbers of Satanists in the world, the largest of which is under 100,000. Further, I don’t ever remember seeing a single Satanist meeting facility, even in San Francisco. A web search also reveals a good number of conspicuously Christian death metal bands, including Leviticus, named above. Without getting into the details of Bayes Theorem, it is probably obvious that the relative frequencies of Christians against Satanists governs the outcome. And judging Vic by his appearance is likely very unreliable.

South Park Community Presbyterian Church
Fairplay, Colorado
Wisdom and Madness of the Yelp Crowd
Posted by Bill Storage in Crowd wisdom, Multidisciplinarians, Probability and Risk on April 20, 2012
 I’ve been digging deep into Yelp and other sites that collect crowd ratings lately; and I’ve discovered wondrous and fascinating things. I’ve been doing this to learn more about when and how crowds are wise. Potential inferences about “why” are alluring too. I looked at two main groups of reviews, those for doctors and medical services, and reviews for restaurants and entertainment.
As doctors, dentists and those in certain other service categories are painfully aware, Yelp ratings do not follow the expected distribution of values. This remains true despite Yelp’s valiant efforts to weed out shills, irate one-offs and spam.
Just how skewed are Yelp ratings when viewed in the aggregate? I took a fairly deep look and concluded that big bias lurks in the big data of Yelp. I’ll get to some hard numbers and take a crack at some analysis. First a bit of background.
Yelp data comes from a very non-random sample of a population. One likely source of this adverse selection is that those who are generally satisfied with service tend not to write reviews. Many who choose to write reviews want their ratings to be important, so they tend to avoid ratings near the mean value. Another source of selection bias stems from Yelp’s huge barrier – in polling terms anyway – to voting. Yelp users have to write a review before they can rate, and most users can’t be bothered. Further, those who vote are Yelp members who have (hopefully) already used the product or service, which means there’s a good chance they read other reviews before writing theirs. This brings up the matter of independence of members.
Plenty of tests – starting with Francis Galton’s famous ox-weighing study in 1906 – have shown that the median value of answers to quantitative questions in a large random crowd is often more accurate than answers by panels of experts. Crowds do very well at judging the number of jellybeans in the jar and reasonably well at guessing the population of Sweden, the latter if you take the median value rather than the mean. But gross misapplications of this knowledge permeate the social web. Fans of James Surowiecki’s “The Wisdom of Crowds” very often forget that independence is essential condition of crowd wisdom. Without that essential component to crowd wisdom, crowds can do things like burning witches and running up stock prices during the dot com craze. Surowiecki acknowledges the importance of this from the start (page 5):
There are two lessons to be drawn from the experiments. In most of them the members of the group were not talking to each other or working on a problem together.
Influence and communication love connections; but crowd wisdom relies on independence of its members, not collaboration between them. Surowiecki also admits, though rather reluctantly, that crowds do best in a subset of what he calls cognition problems – specifically, objective questions with quantitative answers. Surowiecki has great hope for use of crowds in subjective cognition problems along with coordination and cooperation problems. I appreciate his optimism, but don’t find his case for these very convincing.
In Yelp ratings, the question being answered is far from objective, despite the discrete star ratings. Subjective questions (quality of service) cannot be made objective by constraining answers to numerical values. Further, there is no agreement on what quality is really being measured. For doctors, some users rate bedside manner, some the front desk, some the outcome of ailment, and some billing and insurance handling. Combine that with self-selection bias and non-independence of users and the wisdom of the crowd – if present – can have difficulty expressing itself.
Two doctors on my block have mean Yelp ratings of 3.7 and 3.0 stars on a scale of 1 to 5. Their sample standard deviations are 1.7 and 1.9 (mean absolute deviations: 1.2 and 1.8). Since the maximum possible population standard deviation for a doctor on Yelp is 2.0, everything about this doctor data should probably be considered next to useless; it’s mean and even median aren’t reliable. The distributions of ratings isn’t merely skewed; it’s bimodal in these two cases and for half of the doctors in San Francisco. That means the rating survey yields highly conflicting results for doctors. Here are the Yelp scores of doctors in my neighborhood.
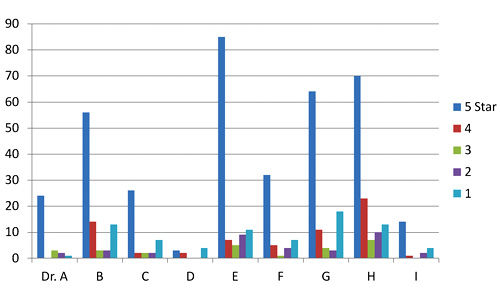
Yelp rating distribution for 9 nearby doctors
I’ve been watching the doctor ratings over the last few years. A year ago, Dr. E’s ratings looked rather like Dr. I’s ratings look today. Unlike restaurants, which experience a rating warm-start on Yelp, the 5-star ratings of doctors grow over time at a higher rate than their low ratings. Doctors, some having been in business for decades, appear to get better as Yelp gets more popular. Three possible explanations come to mind. The first deals with competition. The population of doctors, like any provider in a capitalist system, is not fixed. Those who fare poorly in ratings are likely to get fewer customers and go out of business. The crowd selects doctors for quality, so in a mature system, most doctors, restaurants, and other businesses will have above-average ratings.
The second possible explanation for the change in ratings over time deals with selection, not in the statistics sense (not adverse selection) but in the social-psychology sense (clan or community formation). This would seem more likely to apply to restaurants than to doctors, but the effect on urban doctors may still be large. People tend to select friends or communities of people like themselves – ethnic, cultural, political, or otherwise. Referrals by satisfied customers tend to bring in more customers who are more likely to be satisfied. Businesses end up catering to the preferences of a group, which pre-selects customers more likely to be satisfied and give high ratings.
A third reason for the change over time could be a social-influence effect. People may form expectations based on the dominant mood of reviews they read before their visit. So later reviews might greatly exaggerate any preferences visible in early reviews.
Automotive services don’t fare much better on Yelp than doctors and dentists. But rating distributions for music venues, hotels and restaurants, though skewed toward high ratings, aren’t bimodal like the doctor data. The two reasons given above for positive skew in doctors’ ratings are likely both at work in restaurants and hotels. Yelp ratings for restaurants give clues about those who contribute them.
 I examined about 10,000 of my favorite California restaurants, excluding fast food chains. I was surprised to find that the standard deviation of ratings for each restaurant increased – compared to theoretical maximum values – as average ratings increased. If that’s hard to follow in words, the below scatter plot will drive the point home. It shows average rating vs. standard deviation for each of 10,000 restaurants. Ratings are concentrated at the right side of the plot, and are clustered fairly near the theoretical maximum standard deviation (the gray elliptical arc enclosing the data points) for any given average rating. Color indicate rough total rating counts contributing to each spot on the plot – yellow for restaurants with 5 or less ratings, red for those having 40 or less, and blue for those with more than 40 ratings. (Some points are outside the ellipse because it represents maximum population deviations and the points are sample standard deviations.)
The second scatter shows average rating vs. standard deviation for the Yelp users who rated these restaurants, with the same color scheme. Similarly, it shows that most raters rate high on average, but each voter still tends to rate at the extreme ends possible to yield his average value. For example, many raters whose average rating is 4 stars use far more 3 and 5-star ratings than nature would expect.

Scatter plot of standard deviation vs. average Yelp rating for about 10,000 restaurants

Scatter plot of standard deviation vs. average rating for users who rated 10,000 restaurants
Next I looked at the rating behavior of users who rate restaurants. The first thing that jumps out of Yelp user data is that the vast majority of Yelp restaurant ratings are made by users who have rated only one to five restaurants. A very small number have rated more than twenty.

Rating counts of restaurant raters by activity level
A look at comparative distribution of the three activity levels (1 to 5, 6 to 20, and over 20) as percentages of category total shows that those who rate least are more much more likely to give extreme ratings. This is a considerable amount of bias, throughout 100,000 users making half a million ratings. In a 2009 study of Amazon users, Vassilis Kostakos found similar results in their ratings to what we’re seeing here for bay area restaurants.

Normalized rating counts of restaurant raters by activity level
Can any practical wisdom be applied to this observation of crowd bias? Perhaps a bit. For those choosing doctors based on reviews, we can suggest that doctors with low rating counts, having both very high and very low ratings, will likely look better a year from now. Restaurants with low rating counts (count of ratings, not value) are likely to be more average than their average rating values suggest (no negative connotation to average here). Yelp raters should refrain from hyperbole, especially in their early days of rating. Those putting up rating/review sites should be aware that seemingly small barriers to the process of rating may be important, since the vast majority of raters only rate a few items.
This data doesn’t really give much insight into the contribution of social influence to the crowd bias we see here. That fascinating and important topic is at the intersection of crowdsourcing and social technology. More on that next time.

Recent Comments