Archive for category Crowd wisdom
Collective Decisions and Social Influence
Posted by Bill Storage in Crowd wisdom, Multidisciplinarians on April 26, 2012
 People have practiced collective decision-making here and there since antiquity. Many see modern social connectedness as offering great new possibilities for the concept. I agree, with a few giant caveats. I’m fond of the topic because I do some work in the field and because it is multidisciplinary, standing at the intersection of technology and society. I’ve written a couple of recent posts on related topics. A lawyer friend emailed me to say she was interested in my recent post on Yelp and crowd wisdom. She said the color-coded scatter plots were pretty; but she wondered if I had a version with less whereas and more therefore. I’ll do that here and give some high points from some excellent studies I’ve read on the topic.
First, in my post on the Yelp data, I accepted that many studies have shown that crowds can be wise. When large random crowds respond individually to certain quantitative questions, the median or geometric mean (though not the mean value) is often more accurate than answers by panels of experts. This requires that crowd members know at least a little something about the matter they’re voting on.
Then my experiments with Yelp data confirmed what others found in more detailed studies of similar data:
- Yelp raters tend to give extreme ratings.
- Ratings are skewed toward the high end.
- Even a rater who rates high on average still rates many businesses very low.
- Many businesses in certain categories have bimodal distributions – few average ratings, many high and low ratings.
- Young businesses are more like to show bimodal distributions; established ones right-skewed.
I noted that these characteristics would reduce statisticians’ confidence in conclusions drawn from the data. I then speculated that social influence contributed to these characteristics of the data, also seen in detailed studies published on Amazon, Imdb and other high-volume sites. Some of those studies actually quantified social influence.
Two of my favorite studies show how mild social influence can damage crowd wisdom; and how a bit more can destroy it altogether. Both studies are beautiful examples of design of experiments and analysis of data.
In one (Lorenz, et. al., full citation below), the experimenters asked six questions to twelve groups of twelve students. In half the groups, people answered questions with no knowledge of the other members’ responses. In the other groups the experimenters reported information on the group’s responses to all twelve people in that group. Each member in such groups could then give new answers. They repeated the process five times allowing each member to revise and re-revise his response with knowledge about his group’s answers, and did statistical analyses on the results. The results showed that while the groups were initially wise, knowledge about the answers of others narrowed the range of answers. But this reduced range did not reduce collective error. This convergence is often called the social influence effect.
A related aspect of the change in a group’s answers might be termed the range reduction effect. It describes that fact that the correct answer moves progressively toward the periphery of the ordered group of answers as members revise their answers. A key consequence of this effect is that representatives of the crowd become less valuable in giving advice to external observers.
The most fascinating aspect of this study was the confidence effect. Communication of responses by other members of a group increased individual members’ confidence about their responses during convergence of their estimates – despite no increase in accuracy. One needn’t reach far to find examples in the form of unfounded guru status, overconfident but misled elitists, and Teflon financial advisors.
Another favorite of the many studies quantifying social influence (Salganik, et. al.) built a music site where visitors could listen to previously-unreleased songs and download them. Visitors were randomly placed in one of eight isolated groups. All groups listened to songs, rated them, and were allowed to download a copy. In some of the groups visitors could see a download count of each song, though this information was not emphasized. The download count, where present, was a weak indicator of the preferences of other visitors. Ratings from groups with no download count information yielded a measurement of song quality as judged by a large population (14,000 participants total). Behavior of the groups with visible download counts allowed the experimenters to quantify the effect of mild social influence.
The results of the music experiment were profound. It showed that mild social influence contributes greatly to inequality of outcomes in the music market. More importantly, it showed, by comparison of the isolated populations that could see download count, that social influence introduces instability and unpredictability in the results. That is, wildly different “hits” emerged in the identical groups when social influence was possible. In an identical parallel universe, Rihanna did just OK and Donnie Darko packed theaters for months.
Engineers and mathematicians might correctly see this instability situation as something like a third order dynamic system, highly sensitive to initial conditions. The first vote cast in each group was the flapping of the butterfly’s wings in Brazil that set off a tornado in Texas.
This study’s authors point out the ramifications of their work on our thoughts about popular success. Hit songs, top movies and superstars are orders of magnitude more successful than their peers. This leads to the sentiment that superstars are fundamentally different from the rest. Yet the study’s results show that success was weakly related to quality. The best songs were rarely unpopular; and the worst rarely were hits. Beyond that, anything could and did happen.
This probably explains why profit-motivated experts do so poorly at predicting which products will succeed, even minutes before a superstar emerges.
When information about a group is available, its members do not make decisions independently, but are influenced subtly or strongly by their peers. When more group information is present (stronger social influence), collective results become increasingly skewed and increasingly unpredictable.
The wisdom of crowds comes from aggregation of independent input. It is a matter of statistics, not of social psychology. This crucial fact seems to be missed by many of the most distinguished champions of crowdsourcing, collective wisdom, crowd-based-design and the like. Collective wisdom can be put to great use in crowdsourcing and collective decision making. The wisdom of crowds is real, and so is social influence; both can be immensely useful. Mixing the two makes a lot of sense in the many business cases where you seek bias and non-individualistic preferences, such as promoting consumer sales.
But extracting “truth” from a crowd is another matter – still entirely possible, in some situations, under controlled conditions. But in other situations, we’re left with the dilemma of encouraging information exchange while maintaining diversity, independence, and individuality. Too much social influence (which could be quite a small amount) in certain collective decisions about governance and the path forward might result in our arriving at a shocking place and having no idea how we got there. History provides some uncomfortable examples.
_______________
Sources cited:
Jan Lorenza, Heiko Rauhutb, Frank Schweitzera, and Dirk Helbing. “How social influence can undermine the wisdom of crowd effect” Proceedings of the National Acadamy of Science, May 31 2011.
Matthew J. Salganik, Peter Sheridan Dodds et. al. “Experimental Study of Inequality and Unpredictability in an Artificial Cultural Market,” Science Feb 10 2006.
Wisdom and Madness of the Yelp Crowd
Posted by Bill Storage in Crowd wisdom, Multidisciplinarians, Probability and Risk on April 20, 2012
 I’ve been digging deep into Yelp and other sites that collect crowd ratings lately; and I’ve discovered wondrous and fascinating things. I’ve been doing this to learn more about when and how crowds are wise. Potential inferences about “why” are alluring too. I looked at two main groups of reviews, those for doctors and medical services, and reviews for restaurants and entertainment.
As doctors, dentists and those in certain other service categories are painfully aware, Yelp ratings do not follow the expected distribution of values. This remains true despite Yelp’s valiant efforts to weed out shills, irate one-offs and spam.
Just how skewed are Yelp ratings when viewed in the aggregate? I took a fairly deep look and concluded that big bias lurks in the big data of Yelp. I’ll get to some hard numbers and take a crack at some analysis. First a bit of background.
Yelp data comes from a very non-random sample of a population. One likely source of this adverse selection is that those who are generally satisfied with service tend not to write reviews. Many who choose to write reviews want their ratings to be important, so they tend to avoid ratings near the mean value. Another source of selection bias stems from Yelp’s huge barrier – in polling terms anyway – to voting. Yelp users have to write a review before they can rate, and most users can’t be bothered. Further, those who vote are Yelp members who have (hopefully) already used the product or service, which means there’s a good chance they read other reviews before writing theirs. This brings up the matter of independence of members.
Plenty of tests – starting with Francis Galton’s famous ox-weighing study in 1906 – have shown that the median value of answers to quantitative questions in a large random crowd is often more accurate than answers by panels of experts. Crowds do very well at judging the number of jellybeans in the jar and reasonably well at guessing the population of Sweden, the latter if you take the median value rather than the mean. But gross misapplications of this knowledge permeate the social web. Fans of James Surowiecki’s “The Wisdom of Crowds” very often forget that independence is essential condition of crowd wisdom. Without that essential component to crowd wisdom, crowds can do things like burning witches and running up stock prices during the dot com craze. Surowiecki acknowledges the importance of this from the start (page 5):
There are two lessons to be drawn from the experiments. In most of them the members of the group were not talking to each other or working on a problem together.
Influence and communication love connections; but crowd wisdom relies on independence of its members, not collaboration between them. Surowiecki also admits, though rather reluctantly, that crowds do best in a subset of what he calls cognition problems – specifically, objective questions with quantitative answers. Surowiecki has great hope for use of crowds in subjective cognition problems along with coordination and cooperation problems. I appreciate his optimism, but don’t find his case for these very convincing.
In Yelp ratings, the question being answered is far from objective, despite the discrete star ratings. Subjective questions (quality of service) cannot be made objective by constraining answers to numerical values. Further, there is no agreement on what quality is really being measured. For doctors, some users rate bedside manner, some the front desk, some the outcome of ailment, and some billing and insurance handling. Combine that with self-selection bias and non-independence of users and the wisdom of the crowd – if present – can have difficulty expressing itself.
Two doctors on my block have mean Yelp ratings of 3.7 and 3.0 stars on a scale of 1 to 5. Their sample standard deviations are 1.7 and 1.9 (mean absolute deviations: 1.2 and 1.8). Since the maximum possible population standard deviation for a doctor on Yelp is 2.0, everything about this doctor data should probably be considered next to useless; it’s mean and even median aren’t reliable. The distributions of ratings isn’t merely skewed; it’s bimodal in these two cases and for half of the doctors in San Francisco. That means the rating survey yields highly conflicting results for doctors. Here are the Yelp scores of doctors in my neighborhood.
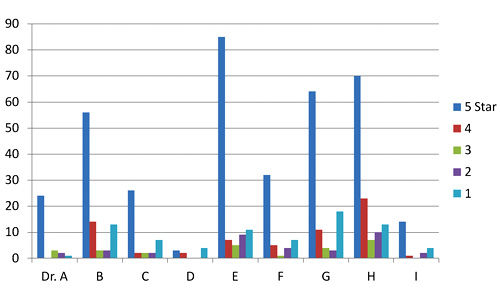
Yelp rating distribution for 9 nearby doctors
I’ve been watching the doctor ratings over the last few years. A year ago, Dr. E’s ratings looked rather like Dr. I’s ratings look today. Unlike restaurants, which experience a rating warm-start on Yelp, the 5-star ratings of doctors grow over time at a higher rate than their low ratings. Doctors, some having been in business for decades, appear to get better as Yelp gets more popular. Three possible explanations come to mind. The first deals with competition. The population of doctors, like any provider in a capitalist system, is not fixed. Those who fare poorly in ratings are likely to get fewer customers and go out of business. The crowd selects doctors for quality, so in a mature system, most doctors, restaurants, and other businesses will have above-average ratings.
The second possible explanation for the change in ratings over time deals with selection, not in the statistics sense (not adverse selection) but in the social-psychology sense (clan or community formation). This would seem more likely to apply to restaurants than to doctors, but the effect on urban doctors may still be large. People tend to select friends or communities of people like themselves – ethnic, cultural, political, or otherwise. Referrals by satisfied customers tend to bring in more customers who are more likely to be satisfied. Businesses end up catering to the preferences of a group, which pre-selects customers more likely to be satisfied and give high ratings.
A third reason for the change over time could be a social-influence effect. People may form expectations based on the dominant mood of reviews they read before their visit. So later reviews might greatly exaggerate any preferences visible in early reviews.
Automotive services don’t fare much better on Yelp than doctors and dentists. But rating distributions for music venues, hotels and restaurants, though skewed toward high ratings, aren’t bimodal like the doctor data. The two reasons given above for positive skew in doctors’ ratings are likely both at work in restaurants and hotels. Yelp ratings for restaurants give clues about those who contribute them.
 I examined about 10,000 of my favorite California restaurants, excluding fast food chains. I was surprised to find that the standard deviation of ratings for each restaurant increased – compared to theoretical maximum values – as average ratings increased. If that’s hard to follow in words, the below scatter plot will drive the point home. It shows average rating vs. standard deviation for each of 10,000 restaurants. Ratings are concentrated at the right side of the plot, and are clustered fairly near the theoretical maximum standard deviation (the gray elliptical arc enclosing the data points) for any given average rating. Color indicate rough total rating counts contributing to each spot on the plot – yellow for restaurants with 5 or less ratings, red for those having 40 or less, and blue for those with more than 40 ratings. (Some points are outside the ellipse because it represents maximum population deviations and the points are sample standard deviations.)
The second scatter shows average rating vs. standard deviation for the Yelp users who rated these restaurants, with the same color scheme. Similarly, it shows that most raters rate high on average, but each voter still tends to rate at the extreme ends possible to yield his average value. For example, many raters whose average rating is 4 stars use far more 3 and 5-star ratings than nature would expect.

Scatter plot of standard deviation vs. average Yelp rating for about 10,000 restaurants

Scatter plot of standard deviation vs. average rating for users who rated 10,000 restaurants
Next I looked at the rating behavior of users who rate restaurants. The first thing that jumps out of Yelp user data is that the vast majority of Yelp restaurant ratings are made by users who have rated only one to five restaurants. A very small number have rated more than twenty.

Rating counts of restaurant raters by activity level
A look at comparative distribution of the three activity levels (1 to 5, 6 to 20, and over 20) as percentages of category total shows that those who rate least are more much more likely to give extreme ratings. This is a considerable amount of bias, throughout 100,000 users making half a million ratings. In a 2009 study of Amazon users, Vassilis Kostakos found similar results in their ratings to what we’re seeing here for bay area restaurants.

Normalized rating counts of restaurant raters by activity level
Can any practical wisdom be applied to this observation of crowd bias? Perhaps a bit. For those choosing doctors based on reviews, we can suggest that doctors with low rating counts, having both very high and very low ratings, will likely look better a year from now. Restaurants with low rating counts (count of ratings, not value) are likely to be more average than their average rating values suggest (no negative connotation to average here). Yelp raters should refrain from hyperbole, especially in their early days of rating. Those putting up rating/review sites should be aware that seemingly small barriers to the process of rating may be important, since the vast majority of raters only rate a few items.
This data doesn’t really give much insight into the contribution of social influence to the crowd bias we see here. That fascinating and important topic is at the intersection of crowdsourcing and social technology. More on that next time.
