“The first thing we do, let’s kill all the lawyers.” – Shakespeare, Henry VI, Part 2, Act IV
My last post discussed the failure of most physicians to infer the chance a patient has the disease given a positive test result where both the frequency of the disease in the population and the accuracy of the diagnostic test are known. The probability that the patient has the disease can be hundreds or thousands of times lower than the accuracy of the test. The problem in reasoning that leads us to confuse these very different likelihoods is one of several errors in logic commonly called the prosecutor’s fallacy. The important concept is conditional probability. By that we mean simply that the probability of x has a value and that the probability of x given that y is true has a different value. The shorthand for probability of x is p(x) and the shorthand for probability of x given y is p(x|y).
“Punching, pushing and slapping is a prelude to murder,” said prosecutor Scott Gordon during the trial of OJ Simpson for the murder of Nicole Brown. Alan Dershowitz countered with the argument that the probability of domestic violence leading to murder was very remote. Dershowitz (not prosecutor but defense advisor in this case) was right, technically speaking. But he was either as ignorant as the physicians interpreting the lab results or was giving a dishonest argument, or possibly both. The relevant probability was not the likelihood of murder given domestic violence, it was the likelihood of murder given domestic violence and murder. “The courtroom oath – to tell the truth, the whole truth and nothing but the truth – is applicable only to witnesses,” said Dershowitz in The Best Defense. In Innumeracy: Mathematical Illiteracy and Its Consequences. John Allen Paulos called Dershowitz’s point “astonishingly irrelevant,” noting that utter ignorance about probability and risk “plagues far too many otherwise knowledgeable citizens.” Indeed.
The doctors’ mistake in my previous post was confusing
P(positive test result) vs.
P(disease | positive test result)
Dershowitz’s argument confused
P(husband killed wife | husband battered wife) vs.
P(husband killed wife | husband battered wife | wife was killed)
In Reckoning With Risk, Gerd Gigerenzer gave a 90% value for the latter Simpson probability. What Dershowitz cited was the former, which we can estimate at 0.1%, given a wife-battery rate of one in ten, and wife-murder rate of one per hundred thousand. So, contrary to what Dershowitz implied, prior battery is a strong indicator of guilt when a wife has been murdered.
As mentioned in the previous post, the relevant mathematical rule does not involve advanced math. It’s a simple equation due to Pierre-Simon Laplace, known, oddly, as Bayes’ Theorem:
P(A|B) = P(B|A) * P(A) / P(B)
If we label the hypothesis (patient has disease) as D and the test data as T, the useful form of Bayes’ Theorem is
P(D|T) = P(T|D) P(D) / P(T) where P(T) is the sum of probabilities of positive results, e.g.,
P(T) = P(T|D) * P(D) + P(T | not D) * P(not D) [using “not D” to mean “not diseased”]
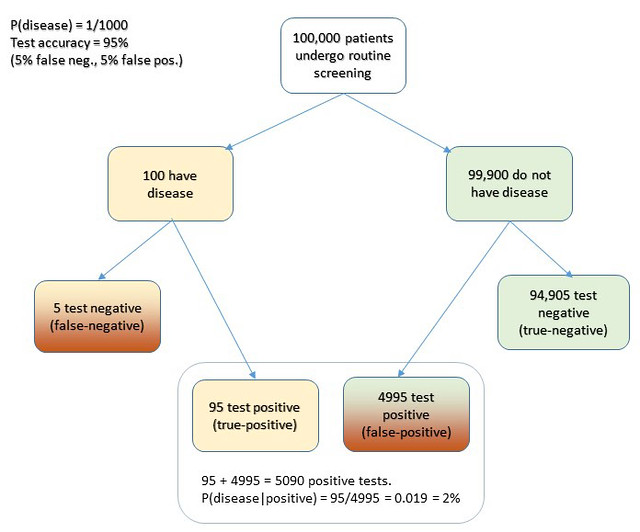
Cascells’ phrasing of his Harvard quiz was as follows: “If a test to detect a disease whose prevalence is 1 out of 1,000 has a false positive rate of 5 percent, what is the chance that a person found to have a positive result actually has the disease?”
Plugging in the numbers from the Cascells experiment (with the parameters Cascells provided shown below in bold and the correct answer in green):
- P(D) is the disease frequency = 0.001 [ 1 per 1000 in population ] therefore:
- P(not D) is 1 – P(D) = 0.999
- P(T | not D) = 5% = 0.05 [ false positive rate also 5%] therefore:
- P(T | D) = 95% = 0.95 [ i.e, the false negative rate is 5% ]
Substituting:
P(T) = .95 * .001 + .999 * .05 = 0.0509 ≈ 5.1% [ total probability of a positive test ]
P(D|T) = .95 * .001 / .0509 = .0019 ≈ 2% [ probability that patient has disease, given a positive test result ]
Voila.
I hope this seeing is believing illustration of Cascells’ experiment drives the point home for those still uneasy with equations. I used Cascells’ rates and a population of 100,000 to avoid dealing with fractional people:
Extra credit: how exactly does this apply to Covid, news junkies?
Edit 5/21/20. An astute reader called me on an inaccuracy in the diagram. I used an approximation, without identifying it. P = r1/r2 is a cheat for P = 1 – Exp(- r1/r2). The approximation is more intuitive, though technically wrong. It’s a good cheat, for P values less that 10%.
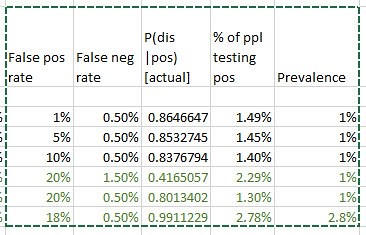
Note 5/22/20. In response to questions about how this sort of thinking bears on coronavirus testing -what test results say about prevalence – consider this. We really have one equation in 3 unknowns here: false positive rate, false negative rate, and prevalence in population. A quick Excel variations study using false positive rates from 1 to 20% and false neg rates from 1 to 3 percent, based on a quick web search for proposed sensitivity/specificity for the Covid tests is revealing. Taking the low side of the raw positive rates from the published data (1 – 3%) results in projected prevalence roughly equal to the raw positive rates. I.e., the false positives and false negatives happen to roughly wash out in this case. That also leaves P(d|t) in the range of a few percent.

#1 by Bishop Cohen on May 8, 2020 - 8:37 pm
Highly educational.
Thanks!!!
#2 by Bill Storage on May 13, 2020 - 10:06 am
Hey, Bishop. Good to hear from you! Hope you’re doing well.