Wikipedia describes risk-neutrality in these terms: “A risk neutral party’s decisions are not affected by the degree of uncertainty in a set of outcomes, so a risk-neutral party is indifferent between choices with equal expected payoffs even if one choice is riskier”
While a useful definition, it doesn’t really help us get to the bottom of things since we don’t all remotely agree on what “riskier” means. Sometimes, by “risk,” we mean an unwanted event: “falling asleep at the wheel is one of the biggest risks of nighttime driving.” Sometimes we equate “risk” with the probability of the unwanted event: “the risk of losing in roulette is 35 out of 36. Sometimes we mean the statistical expectation. And so on.
When the term “risk” is used in technical discussions, most people understand it to involve some combination of the likelihood (probability) and cost (loss value) of an unwanted event.
We can compare both the likelihoods and the costs of different risks, but deciding which is “riskier” using a one-dimensional range (i.e., higher vs. lower) requires a scalar calculus of risk. If risk is a combination of probability and severity of an unwanted outcome, riskier might equate to a larger value of the arithmetic product of the relevant probability (a dimensionless number between zero and one) and severity, measured in dollars.
But defining risk as such a scalar (area under the curve, therefore one dimensional) value is a big step, one that most analyses of human behavior suggests is not an accurate representation of how we perceive risk. It implies risk-neutrality.
Most people agree, as Wikipedia states, that a risk-neutral party’s decisions are not affected by the degree of uncertainty in a set of outcomes. On that view, a risk-neutral party is indifferent between all choices having equal expected payoffs.
Under this definition, if risk-neutral, you would have no basis for preferring any of the following four choices over another:
1) a 50% chance of winning $100.00
2) An unconditional award of $50.
3) A 0.01% chance of winning $500,000.00
4) A 90% chance of winning $55.56.
If risk-averse, you’d prefer choices 2 or 4. If risk-seeking, you’d prefer 1 or 3.
Now let’s imagine, instead of potential winnings, an assortment of possible unwanted events, termed hazards in engineering, for which we know, or believe we know, the probability numbers. One example would be to simply turn the above gains into losses:
1) a 50% chance of losing $100.00
2) An unconditional payment of $50.
3) A 0.01% chance of losing $500,000.00
4) A 90% chance of losing $55.56.
In this example, there are four different hazards. Many argue that rational analysis of risk entails quantification of hazard severities, independent of whether their probabilities are quantified. Above we have four risks, all having the same $50 expected value (cost), labeled 1 through 4. Whether those four risks can be considered equal depends on whether you are risk-neutral.
If forced to accept one of the four risks, a risk-neutral person would be indifferent to the choice; a risk seeker might choose risk 3, etc. Banks are often found to be risk-averse. That is, they will pay more to prevent risk 3 than to prevent risk 4, even though they have the same expected value. Viewed differently, banks often pay much more to prevent one occurrence of hazard 3 (cost = $500,000) than to prevent 9000 occurrences of hazard 4 (cost = $500,000).
Businesses compare risks to decide whether to reduce their likelihood, to buy insurance, or to take other actions. They often use a heat-map approach (sometimes called risk registers) to visualize risks. Heat maps plot probability vs severity and view any particular risk’s riskiness as the area of the rectangle formed by the axes and the point on the map representing that risk. Lines of constant risk therefore look like y = 1 / x. To be precise, they take the form of y = a/x where a represents a constant number of dollars called the expected value (or mathematical expectation or first moment) depending on area of study.
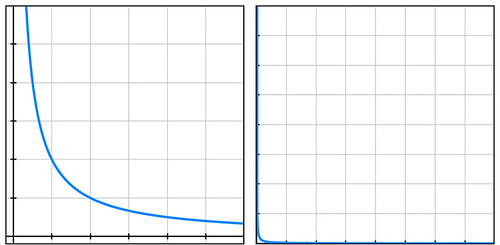
By plotting the four probability-cost vector values (coordinates) of the above four risks, we see that they all fall on the same line of constant risk. A sample curve of this form, representing a line of constant risk appears below on the left.
In my example above, the four points (50% chance of losing $100, etc.) have a large range of probabilities. Plotting these actual values on a simple grid isn’t very informative because the data points are far from the part of the plotted curve where the bend is visible (plot below on the right).
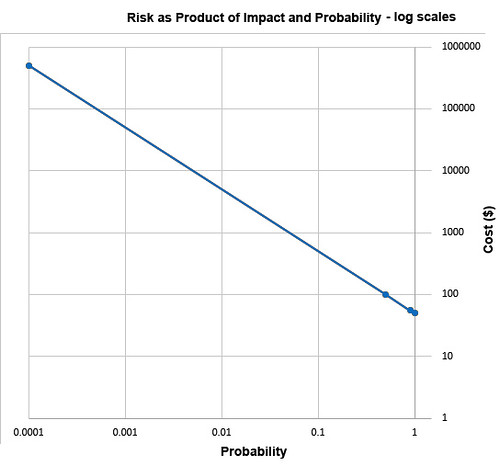
Students of high-school algebra know the fix for the problem of graphing data of this sort (monomials) is to use log paper. By plotting equations of the form described above using logarithmic scales for both axes, we get a straight line, having data points that are visually compressed, thereby taming the large range of the data, as below.
The risk frameworks used in business take a different approach. Instead of plotting actual probability values and actual costs, they plot scores, say from one ten. Their reason for doing this is more likely to convert an opinion into a numerical value than to cluster data for easy visualization. Nevertheless, plotting scores – on linear, not logarithmic, scales – inadvertently clusters data, though the data might have lost something in the translation to scores in the range of 1 to 10. In heat maps, this compression of data has the undesirable psychological effect of implying much small ranges for the relevant probability values and costs of the risks under study.
A rich example of this effect is seen in the 2002 PmBok (Project Management Body of Knowledge) published by the Project Management Institute. It assigns a score (which it curiously calls a rank) of 10 for probability values in the range of 0.5, a score of 9 for p=0.3, and a score of 8 for p=0.15. It should be obvious to most having a background in quantified risk that differentiating failure probabilities of .5, .3, and .15 is pointless and indicative of bogus precision, whether the probability is drawn from observed frequencies or from subjectivist/Bayesian-belief methods.
The methodological problem described above exists in frameworks that are implicitly risk-neutral. The real problem with the implicit risk-neutrality of risk frameworks is that very few of us – individuals or corporations – are risk-neutral. And no framework is right to tell us that we should be. Saying that it is somehow rational to be risk-neutral pushes the definition of rationality too far.
As proud king of a small distant planet of 10 million souls, you face an approaching comet that, on impact, will kill one million (10%) in your otherwise peaceful world. Your scientists and engineers rush to build a comet-killer nuclear rocket. The untested device has a 90% chance of destroying the comet but a 10% chance of exploding on launch thereby killing everyone on your planet. Do you launch the comet-killer, knowing that a possible outcome is total extinction? Or do you sit by and watch one million die from a preventable disaster? Your risk managers see two choices of equal riskiness: 100% chance of losing one million and a 10% chance of losing 10 million. The expected value is one million lives in both cases. But in that 10% chance of losing 10 million, there is no second chance. It’s an existential risk.
If these two choices seem somehow different, you are not risk-neutral. If you’re tempted to leave problems like this in the capable hands of ethicists, good for you. But unaware boards of directors have left analogous dilemmas in the incapable hands of simplistic and simple-minded risk frameworks.
The risk-neutrality embedded in risk frameworks is a subtle and pernicious case of Hume’s Guillotine – an inference from “is” to “ought” concealed within a fact-heavy argument. No amount of data, whether measured frequencies or subjective probability estimates, whether historical expenses or projected costs, even if recorded as PmBok’s scores and ranks, can justify risk-neutrality to parties who are not risk-neutral. So why is it embed it in the frameworks our leading companies pay good money for?
