Posts Tagged technology
Bridging the Gap: Investor – Startup Psychology and What VCs Really Want to Hear
Posted by Bill Storage in Innovation management, Strategy on December 11, 2025
There’s a persistent gap between what investors want to know about startups and what founders present during their pitches. You’ll significantly improve your chance of being funded if you understand investors’ perspective and speak directly to their interests.
I speak with a bit of experience, having been on both sides of the investor conversation. Early in my career, I conducted technology due diligence for Internet Capital Group (ICG) and have since represented VC interests for $20-40M A rounds. I was also twice in the founder’s shoes, successfully raising capital for my own startups, including a $2 million round in 1998, a decent sum back then. The dynamics of pitching evolve, but the core investor psychology remains constant.
Thousands of articles list the top n things to do or not do while pitching. Here I take a more data-driven approach, grounded in investor psychology. By analyzing data on how investors consume pitch decks versus what founders emphasize in live presentations, startups can tune their pitches to align with audience interest and mental biases.
10 Essential Pitch Topics
Fifteen years ago, Sequoia Capital authored their seminal Guide to Pitching. It identified ten primary topics for a startup pitch deck, each to be covered in one or more slides:
- Purpose
- Problem
- Solution
- Why now?
- Market
- Competition
- Business model
- Team
- Financials
- Product
The Shifting Attention Span of Investors
I collected data on where founders spend their time during live pitches from the Silicon Valley Software SIG, videos of pitches found on the web, Band of Angels, and live pitch competitions in the bay area over the last ten years.
I also started tracking DocSend’s data on investors’ pitch deck interest. Their data consistently shows that the average time investors spend reviewing a pitch deck is very brief. The average time dropped from 3 minutes and 27 seconds in 2015 to just 2 minutes and 47 seconds by April 2021. The most recent data from 2024 shows an even tighter window, often averaging just 2 minutes and 35 seconds. Investors are smart, busy, and focused, so pitch decks must cover the right topics clearly and efficiently.
The Persistent Mismatch of Interests
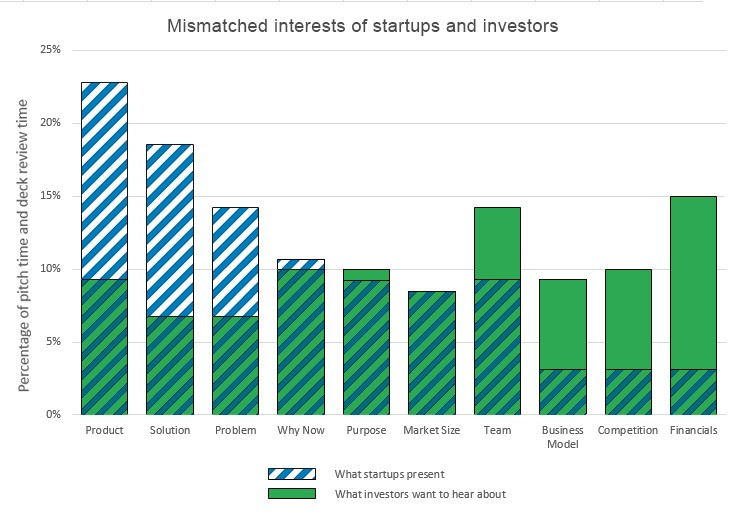
The count of slides in a deck has averaged around 20 for years. Using that as a guide, at least one slide should cover each of the primary Sequoia topics, with some topics needing more real estate.
The combined data on investor viewing time versus founder presentation time reveals a clear mismatch of interest (see chart). From the investor’s perspective, founders still talk far too much about the problem, the solution, and how the product delivers the solution. Conversely, founders talk far too little about the business model, the competition, and financials.
This mismatch highlights something that may seem obvious but is too easily lost in the pursuit of developing great technology: Investors want to know how their money will translate into your growth and their eventual profitable exit. Ultimately, they want to manage their investment risk.
A Great Product Does Not Guarantee a Great Investment
Investors often need little convincing that a business problem exists and that your product is a potential solution. They trust your domain expertise on the problem. But a great product does not necessarily make a great company, and a great company is not necessarily a great investment.
To judge an investment risk as acceptable, investors need to understand your business model in detail.
- How exactly do you get paid for your product?
- What are your primary channels for customer acquisition?
- How much will it cost to acquire each new customer (CAC)?
They want to know that your sales forecasts are plausible. What size of sales force will it take if you’re projecting exponential sales increases?
Competition and Market Realities
Data presented by Ron Weissman at Band of Angels back in 2015 showed that founders gave almost no time at all to their competition. While this has improved slightly, it remains a significant weak area for most pitches.
You should be able to answer key competitive questions transparently:
- Who are your competitors now?
- Who will they be in the future?
- What is their secret sauce?
- What do you do better than all of them?
- Can you maintain that advantage in the future?
You should answer these questions without disparaging your competitors or resorting to the classic red flag that “there are no competitors” (which usually implies there is no market). Differentiation should include aspects of the business – such as distribution, partnerships, or unique data access – not just technical product features.
Focus on Scalability and Use of Funds
Investors are rarely interested in science projects. They want to see a business that can scale rapidly with an injection of capital. Your financial projections must make clear your intended use of funds.
- How much goes to hiring great talent?
- How much to marketing?
- How much to sales?
Investors understand that your projections of future revenue, market share, and customer acquisition costs are hypothetical and based on limited current information. However, they are scrutinizing your ability to think critically about scale. They want proof that it is feasible you’ll reach the key metrics required for your next round of funding before you run out of money.
This emphasis on feasibility and risk mitigation translates directly into a heightened focus on capital efficiency. In today’s market, VCs prioritize companies that can do more with less. Pitches need to clearly articulate a path to profitability or sustainable growth that minimizes cash burn. Investors want to see that founders have a credible plan to achieve significant milestones within 18-24 months without needing another immediate cash infusion. Demonstrating a capital-efficient operational plan is now as critical as projecting believable revenue growth.
I hope you find this material helpful for tuning your pitch deck to its investor audience. Please let me know if I can develop any of these points further.
Removable Climbing Bolt Stress Under Offset Loading
Posted by Bill Storage in Engineering & Applied Physics on November 13, 2025
A Facebook Group has been discussing how load direction affects the stress state of removable bolts and their integral hangers. Hanger geometry causes axial loads to be applied with a small (~ 20mm) offset from the axis of the bolt. One topic of discussion is whether this offset creates a class-2 leverage effect, thereby increasing the stress in the bolt. Other aspects of the physics of these bolts warrant discussion. This can serve as a good starter, specifically addressing the leveraging/prying concern.
Intuition is a poor guide for this kind of problem. Nature doesn’t answer to consensus or gut feeling, and social reasoning won’t reveal how a bolt actually behaves. The only way to understand what’s happening is to go back to basic physics. That’s not a criticism of anyone’s judgment, it’s just the boundary the world imposes on us.
Examining the problem starts with simple physics (statics). Then you need to model how the system stretches and bends. You need to look at its stress state. So you need to calculate. A quick review of the relevant basics of mechanics might help. They are important to check the validity of the mental models we use to represent the real-world situation.
The classic balanced see-saw is at left below. The two 100 lb weights balance each other. The base pushes up on the beam with 200 pounds. We see Newton’s 1st Law in action. Sum of the down forces = sum of the up forces. If we say up forces are positive and down are negative, all the forces on the beam sum to zero. Simple. The see-saw works in tension too. Pull up with 2 ⋅ 100 pounds and the base pulls down by the same amount.
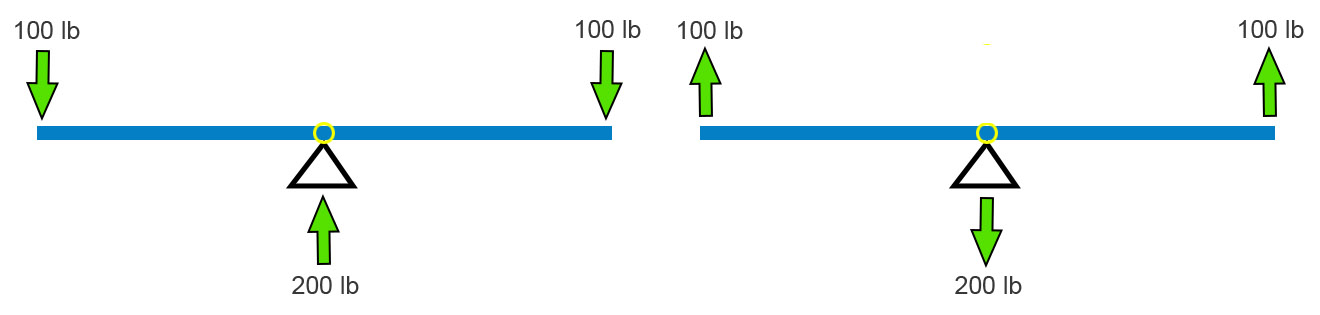
I’m going to stick will pull forces because they fit the bolt example better. A big kid and a little kid can still balance. Move the fulcrum toward the big kid (below left). The force the base pushes up with remains equal to the sum of the downward forces. This has to be in all cases. Newton (1st Law) must be satisfied.

If the fulcrum – the pivot point – freezes up or is otherwise made immobile, the balancing act is no longer needed. The vertical forces still balance each other (cancel each other out), but now their is a twist on the base. Its left side wants to peel up. In addition to the sum of forces equaling zero, the sum of all twists must also sum to zero. A twist – I’ll use its physics name, moment – is defined as a force times the perpendicular distance through which it acts. In the above-right diagram, the 100 lb force is 1 foot from the base, so it applies a 100 ft-lb clockwise moment to the base (1 foot times 100 pounds = 100 ft-lb). (Notice we multiply the numbers and their units.) Therefore, to keep Isaac Newton happy, the ground must apply a 1 ft-lb counterclockwise moment (red curved arrow) to the base and beam that is fixed to it.
Anticipating a common point of confusion, I’ll point out here that, unlike the case where all the force arrows on this sort of “free body” diagram must sum to zero, there won’t necessarily be a visible curved arrow for every moment-balancing effect. Moment balance can exist between (1) a force times distance (100 lb up) and (2) a reaction moment (the counterclockwise moment applied by the ground), not between two drawn curved-arrows. If we focused on the ground and not the frozen see-saw, i.e., if we drew a free-body diagram of the ground and not the see-saw, we’d see a clockwise moment arrow representing the moment applied by the unbalanced base.
That’s all the pure statics we need to analyze these bolts. We’ll need mechanics of materials to analyze stresses. Let’s look at an idealized removable bolt in a hole. In particular, let’s look at an idealized Climbing Taiwan bolt. CT bolts have their integrated hangers welded to the bolt sleeve – fixed, like the base of the final see-saw above.
Figure A below shows an applied load of 100 pounds upward on the hanger. The bolt is anchored to rock at its base, at the bottom of the hole. A blue bolt is inside a pink hanger-sleeve assembly. The rock is pulling down on the base of the bolt with a force equal and opposite to the applied load. And the rock must apply a 100 ft-lb moment to the assembly to satisfy Newton. In figure A, it’s shown at the bottom of the hole.
But it need not be. Moments are global. Unlike forces, they aren’t applied at a point. We can move the curved arrow representing the moment – the twist the earth reacts to the load offset with – to any spot on the bolt assembly, as in the center diagram below. I further simplified the center diagram by removing the sleeve and modeling the situation as a single bolt-hanger assembly with space around it in the hole. For first-order calculations, given the small deflections involved, this simplification is acceptable. It helps us to see the key points.
We can allow the bolt to bend in the hole until it contacts the outside corner of the hole (figure B below). This changes very little besides adding some small counteracting horizontal forces there.

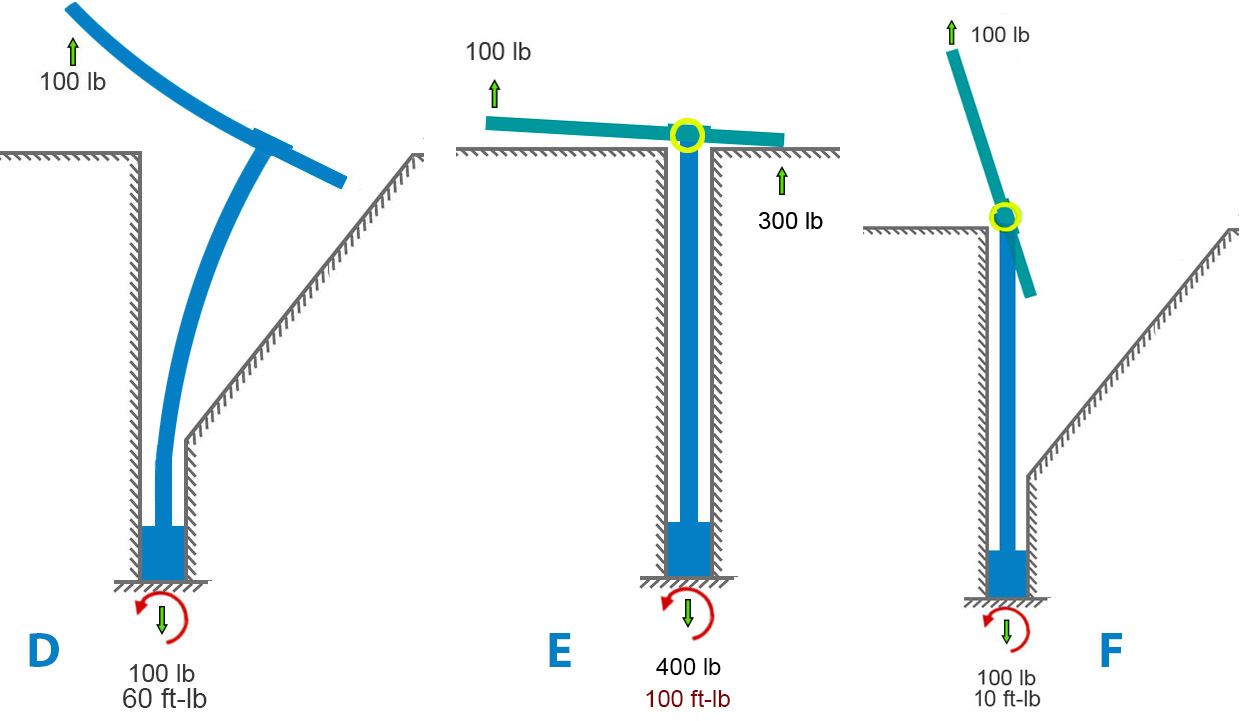
If we remove the rock and model a very bendy bolt, we get something like diagram D below. This leaves the forces unchanged but, in this extreme example, the moment is somewhat reduced because the moment arm (perpendicular distance between bolt and applied force) is considerably reduced by the bending.
We can also examine the case where the hanger is free to rotate on the bolt and sleeve (diagram E below). This is closer to the case of Petzl Pulse bolts. Here the 2nd-class lever mechanism comes into play. A “force-multiplier” is at work. If force-multiplier sounds like a bit of hand -waving, it is – forces aren’t multiplied per-se. We can do better and make Isaac Newton proud. A lever simply balances moments. If your hand is twice as far from the pivot as the load is, your hand needs only half the force because your longer distance gives your force more moment. Same moment, longer arm, smaller force. The 300-lb force at the hanger-rock (right side of bolt, figure E) contact exactly balances the 100-lb force that is three times farther away on the left side. Since both these forces pull upward on the hanger, the frictional force at the bottom of the whole becomes 400 pounds to balance it out. If no rock is on the right side of the hole, the hanger will rotate until it runs into something else (figure F).
Now we can look at stress, our bottom-line concern. Metal and rock and all other solids can take only so much stress, and then they break. For a material – say 304 steel – the stress at which it breaks is called its material strength. Material strength and stress are both measured in pounds per square inch (English) or Pascals (metric, often Megapascals, MPa). As a reference point, 304 steel breaks at a stress of 515 Mpa or 75,000 lb/sq-in. (75 ksi).
I will focus on figures A, B, C (identical for stress calcs), and E, since they are most like the real-world situations we’re concerned with. The various types of stresses all boil down to load divided by dimensions. Tensile stress is easy: axial load divided by cross sectional area. Since I’ve mixed English and metric units (for US reader familiarity), I’ll convert everything to metric units for stress calculation. Engineers use this symbol for stress: σ
Using σ = P/A to calculate axial stress, the numbers are:
- Axial load P= 100 lb =100 lbf = 444.82 N
- cross sectional area A = πd2/4 = 50.27 mm2
- radius c= 4 mm
Axial stress = σax = P/A = 8.85 MPa ≈ 1280 lb/sq-in.
The offset load imparts bending to the bolt. Calculating bending stress involves the concept of second moment of area (aka “cross-sectional moment of inertia” if you’re old-school). Many have tried to explain this concept simply. Fortunately, grasping its “why” is not essential to the point I want to make about axial vs. bending stress here. Nevertheless, here’s a short intro to the 2nd moment of area.
A beam under bending doesn’t care about how much material you have, it cares about how far that material is from the centerline. If you load a beam anchored at its ends in the middle, the top half (roughly) is in compression, the bottom half in tension. Top half squeezed, bottom stretched. Moment of area is a bookkeeping number that captures how much material you have times how far it sits from the centerline, squared. Add up every tiny patch of area, weighting each one by the square of its distance from the centerline. In shorthand, second moment of area (“I”) looks like this: I=∫y2dA
Now that you understand – or have taken on faith – the concept of second moment of area, we can calculate bending stress for the above scenario given the formula, σ = Mc/I.
Using σ = Mc/I, the numbers are:
- second moment I=πd4/64 = 201.06 mm4
- eccentric moment (i.e., the lever arm) = M = Pe=444.82 ⋅ 20 = 8896.44 N
Bending stress, σbend = Mc/I = 176.99 MPa ≈ 25,670 lb/sq-in.
The total stress of the bolt depends on which side of the bolt we are looking at. The maximum tensile stress is on the side that is getting stretched both by the applied axial load (100 lb) and by the fact that this load is offset. On that side of the bolt, we just add the axial and bending stress components (on the other side we would subtract the bending):
σtotal = σax ± σbend = 8.85 MPa + 176.99 MPa = 185.84 MPa ≈ 26,950 lb/sq-in.
Here we see something startling to folk who don’t do this kind of work. For situations like bolts and fasteners, the stress component due to the pullout force with no offset is insignificant compared to the effect of the offset. Bending completely dominates. By a factor of twenty in this case. Increasing the pure axial stress by increasing the applied axial load has little effect on the total stress in the bolt.
If we compare the A/B/C models with the E model, the pure-axial component grows by 18 MPa because of the higher reactive tensile force:
σtotal = σax ± σbend = 26.55 MPa + 176.99 MPa = 203.54 MPa ≈ 29521 lb/sq-in.
Adding the sleeve back to the model changes very little. It would reduce the force-multiplier effect in case E (thereby making it closer to A, B, and C) for several reasons that would take a lot of writing to explain well.
In the case of axially loaded removable bolts (not the use-case for which they were designed – significantly) the offset axial load greatly increases (completely dominates, in fact) the stress in the bolt. When a bolt carries an axial load that’s offset from its centerline, the problem isn’t any leverage created by the hanger’s prying geometry. That leverage effect is trivial. The offset itself produces a bending moment, and that bending drives the stress. For slender round members like bolts, bending overwhelms everything else.
Furthermore, published pull tests and my analysis of rock-limited vs. bolt-limited combinations of bolt diameter, length and rock strength suggest that bolt stress/strength is not a useful criterion for selecting removables. Based on what I’ve seen and experienced so far, I find the CT removables superior to other models for my concerns – durability, maintainability, reducing rock stress, and most importantly, ensuring that the wedge engages the back of the hole.
Statistical Reasoning in Healthcare: Lessons from Covid-19
Posted by Bill Storage in History of Science, Philosophy of Science, Probability and Risk on May 6, 2025
For centuries, medicine has navigated the tension between science and uncertainty. The Covid pandemic exposed this dynamic vividly, revealing both the limits and possibilities of statistical reasoning. From diagnostic errors to vaccine communication, the crisis showed that statistics is not just a technical skill but a philosophical challenge, shaping what counts as knowledge, how certainty is conveyed, and who society trusts.
Historical Blind Spot
Medicine’s struggle with uncertainty has deep roots. In antiquity, Galen’s reliance on reasoning over empirical testing set a precedent for overconfidence insulated by circular logic. If his treatments failed, it was because the patient was incurable. Enlightenment physicians, like those who bled George Washington to death, perpetuated this resistance to scrutiny. Voltaire wrote, “The art of medicine consists in amusing the patient while nature cures the disease.” The scientific revolution and the Enlightenment inverted Galen’s hierarchy, yet the importance of that reversal is often neglected, even by practitioners. Even in the 20th century, pioneers like Ernest Codman faced ostracism for advocating outcome tracking, highlighting a medical culture that prized prestige over evidence. While evidence-based practice has since gained traction, a statistical blind spot persists, rooted in training and tradition.
The Statistical Challenge
Physicians often struggle with probabilistic reasoning, as shown in a 1978 Harvard study where only 18% correctly applied Bayes’ Theorem to a diagnostic test scenario (a disease with 1/1,000 prevalence and a 5% false positive rate yields a ~2% chance of disease given a positive test). A 2013 follow-up showed marginal improvement (23% correct). Medical education, which prioritizes biochemistry over probability, is partly to blame. Abusive lawsuits, cultural pressures for decisiveness, and patient demands for certainty further discourage embracing doubt, as Daniel Kahneman’s work on overconfidence suggests.
Neil Ferguson and the Authority of Statistical Models
Epidemiologist Neil Ferguson and his team at Imperial College London produced a model in March 2020 predicting up to 500,000 UK deaths without intervention. The US figure could top 2 million. These weren’t forecasts in the strict sense but scenario models, conditional on various assumptions about disease spread and response.
Ferguson’s model was extraordinarily influential, shifting the UK and US from containment to lockdown strategies. It also drew criticism for opaque code, unverified assumptions, and the sheer weight of its political influence. His eventual resignation from the UK’s Scientific Advisory Group for Emergencies (SAGE) over a personal lockdown violation further politicized the science.
From the perspective of history of science, Ferguson’s case raises critical questions: When is a model scientific enough to guide policy? How do we weigh expert uncertainty under crisis? Ferguson’s case shows that modeling straddles a line between science and advocacy. It is, in Kuhnian terms, value-laden theory.
The Pandemic as a Pedagogical Mirror
The pandemic was a crucible for statistical reasoning. Successes included the clear communication of mRNA vaccine efficacy (95% relative risk reduction) and data-driven ICU triage using the SOFA score, though both had limitations. Failures were stark: clinicians misread PCR test results by ignoring pre-test probability, echoing the Harvard study’s findings, while policymakers fixated on case counts over deaths per capita. The “6-foot rule,” based on outdated droplet models, persisted despite disconfirming evidence, reflecting resistance to updating models, inability to apply statistical insights, and institutional inertia. Specifics of these issues are revealing.
Mostly Positive Examples:
- Risk Communication in Vaccine Trials (1)
The early mRNA vaccine announcements in 2020 offered clear statistical framing by emphasizing a 95% relative risk reduction in symptomatic COVID-19 for vaccinated individuals compared to placebo, sidelining raw case counts for a punchy headline. While clearer than many public health campaigns, this focus omitted absolute risk reduction and uncertainties about asymptomatic spread, falling short of the full precision needed to avoid misinterpretation. - Clinical Triage via Quantitative Models (2)
During peak ICU shortages, hospitals adopted the SOFA score, originally a tool for assessing organ dysfunction, to guide resource allocation with a semi-objective, data-driven approach. While an improvement over ad hoc clinical judgment, SOFA faced challenges like inconsistent application and biases that disadvantaged older or chronically ill patients, limiting its ability to achieve fully equitable triage. - Wastewater Epidemiology (3)
Public health researchers used viral RNA in wastewater to monitor community spread, reducing the sampling biases of clinical testing. This statistical surveillance, conducted outside clinics, offered high public health relevance but faced biases and interpretive challenges that tempered its precision.
Mostly Negative Examples:
- Misinterpretation of Test Results (4)
Early in the COVID-19 pandemic, many clinicians and media figures misunderstood diagnostic test accuracy, misreading PCR and antigen test results by overlooking pre-test probability. This caused false reassurance or unwarranted alarm, though some experts mitigated errors with Bayesian reasoning. This was precisely the type of mistake highlighted in the Harvard study decades earlier. - Cases vs. Deaths (5)
One of the most persistent statistical missteps during the pandemic was the policy focus on case counts, devoid of context. Case numbers ballooned or dipped not only due to viral spread but due to shifts in testing volume, availability, and policies. COVID deaths per capita rather than case count would have served as a more stable measure of public health impact. Infection fatality rates would have been better still. - Shifting Guidelines and Aerosol Transmission (6)
The “6-foot rule” was based on outdated models of droplet transmission. When evidence of aerosol spread emerged, guidance failed to adapt. Critics pointed out the statistical conservatism in risk modeling, its impact on mental health and the economy. Institutional inertia and politics prevented vital course corrections.
(I’ll defend these six examples in another post.)
A Philosophical Reckoning
Statistical reasoning is not just a mathematical tool – it’s a window into how science progresses, how it builds trust, and its special epistemic status. In Kuhnian terms, the pandemic exposed the fragility of our current normal science. We should expect methodological chaos and pluralism within medical knowledge-making. Science during COVID-19 was messy, iterative, and often uncertain – and that’s in some ways just how science works.
This doesn’t excuse failures in statistical reasoning. It suggests that training in medicine should not only include formal biostatistics, but also an eye toward history of science – so future clinicians understand the ways that doubt, revision, and context are intrinsic to knowledge.
A Path Forward
Medical education must evolve. First, integrate Bayesian philosophy into clinical training, using relatable case studies to teach probabilistic thinking. Second, foster epistemic humility, framing uncertainty as a strength rather than a flaw. Third, incorporate the history of science – figures like Codman and Cochrane – to contextualize medicine’s empirical evolution. These steps can equip physicians to navigate uncertainty and communicate it effectively.
Conclusion
Covid was a lesson in the fragility and potential of statistical reasoning. It revealed medicine’s statistical struggles while highlighting its capacity for progress. By training physicians to think probabilistically, embrace doubt, and learn from history, medicine can better manage uncertainty – not as a liability, but as a cornerstone of responsible science. As John Heilbron might say, medicine’s future depends not only on better data – but on better historical memory, and the nerve to rethink what counts as knowledge.
______
All who drink of this treatment recover in a short time, except those whom it does not help, all of whom die. It is obvious, therefore, that it fails only in incurable cases. – Galen

Demonstration Studies: Interdisciplinary Approaches to Policy Frameworks and Educational Pathways in Collective Action
Posted by Bill Storage in Commentary, Interdisciplinary learning on March 28, 2026
At some point we have to confront the labor imbalance head-on. Our guidance counselors still push the same tired pipeline, STEM, pre-med, maybe a grudging nod to business during the late-capitalism era, while a clearly underdeveloped sector sits right outside our school doors, chanting.
The protest industry is no longer a cottage operation. It has matured into a complex, vertically integrated field with roles spanning logistics, messaging, performance, risk management, and, most crucially, optics. Yet high school seniors are given exactly zero structured exposure. We march past an opportunity that stands before us.
A modern curriculum would correct this. Introductory coursework might range from Slogan Compression, the art of reducing a dubious causal claim to five words and a rhyme, to Sign Engineering, where students learn the tensile limits of corrugated plastic under high wind conditions. Advanced pre-college topics could tackle Strategic Outrage Calibration, a delicate discipline balancing moral fervor with camera awareness.
Internships are obvious and plentiful. Students could rotate through departments: Street Presence, Social Media Amplification, and the always critical Rapid Narrative Adjustment Unit, which specializes in pivoting within the first news cycle. Apprenticeships with seasoned professionals would provide invaluable field experience, especially in high-stakes environments where the difference between “grassroots” and “organized” must remain tastefully subliminal.
Naturally, certification would follow. A tiered credentialing system would help employers distinguish between casual enthusiasts and those with demonstrated competencies in crowd choreography and chant synchronization. Continuing education would be required, given the field’s rapid evolution and the half-life of yesterday’s outrage, an inescapable facet the multidisciplinary practitioner simply must address.
Demand appears remarkably resilient. Issues may change, but the underlying need for visible indignation shows no sign of decline. Automation threatens many traditional careers, but it’s difficult to algorithmically replicate the human capacity for performative sincerity in front of a camera.
In the end, this is also about equity of opportunity. Not every student need submit to the oppression of differential equations or patient care. Some have a natural gift for megaphones, timing, and the instinctive sense of where the lens is. It seems only fair that our educational system recognize such talent, nurture it, and send it out into the world fully credentialed, well-practiced, and ready to make a difference.
Sustainable outrage demands long-term career planning in high-intensity advocacy. Tomorrow’s performative conviction will require assessment models for demonstrative competence. Recent trends show that raw spontaneity is simply unable to meet market demands. Elite programs won’t eliminate it, they will curate it.
My own experience in curriculum design is limited to outmoded domains of engineering and science. With that caveat I humbly propose, as a rough framework for expansion by high school curriculum professionals, something like the following. Underlying this introductory program would be the doctrine of teaching sincerity as a deployable skill rather than a personal trait:
Students workshop facial expressions and vocal strain until they land somewhere between “deeply moved” and “media-ready.” Overacting is penalized, underacting is remediated.
A close reading of acceptable deviation. How far one can drift from the script while still being invited back.
Live exercises where students are prompted with unexpected cues, then evaluated on how convincingly their responses appear unprompted. Focus on plausible deniability.
The old paradox, solved with mirrors and playback. Students learn to anticipate where to stand, sensory memory, and emotional immersion to achieve authentic, realistic performances.
Each student stages a fully “unscripted” episode, complete with organic escalation and tasteful resolution. External reviewers assess authenticity using a standardized index, revised each year to ensure relevance.
Of course, we must face the market reality that not all are cut out for client-facing roles. Fortunately, the industry is flush with blue-ocean organizational and infrastructural opportunities. Emerging industries eventually discover that selling isn’t merely the visible thing, it’s forging everything that makes the visible thing possible. Examples include:
Third-party auditors who certify that a demonstration meets recognized standards of organic feeling. Think ISO, but for indignation. “This protest conforms to Authenticity Protocol 9001.”
Uber, but for turnout. Need 50 people who look plausibly local, available within 90 minutes, with a mix of ages and photogenic diversity? Surge pricing during major news cycles.
Not quite PR, not quite a legal department. Their job is to anticipate how an action will be reframed within the first six hours and pre-position counter-narratives. A kind of high-frequency trading desk for moral framing.
The field still runs on vibes. That’s inefficient. We will standardize KPIs: chant retention rate, sign legibility at 30 feet, camera capture frequency, virality half-life. If you can measure it, your client will pay for improving it.
Borrowing from theme parks, choreographed “journeys” through a demonstration, emotional arcs, moments of crescendo. Participants leave feeling they’ve had an experience, not just attended an event. Premium tier tickets include curated photo opportunities.
Most demonstrations peak in the moment and fade. A firm that repackages footage, testimonials, and authentic reactions into a longer tail of content will extend the lifecycle, with revenue sharing back to organizers.
As the field professionalizes, so will its exposure. Insurance products, permitting strategy, de-escalation protocols that still look spontaneous. While strictly back-office, they are lucrative and indispensable.
None of these involve changing the underlying product. Visible moral urgency remains the headline. The opportunity is everything that sits just behind it, quietly shaping, measuring, and monetizing what calls itself spontaneous.
Conclusion
Professionalizing an emerging dissent exigence requires a structured, forward-looking framework for youth engagement, one that recognizes protest not as episodic expression but as a durable component of the political expression economy. Data-driven communication competencies in activist contexts can be cultivated systematically, if still described as organic, through pedagogies that integrate growth-minded inclusivity, social-emotional calibration, and context-sensitive cultural fluency.
The task before us is not to encourage participation – that threshold has long been crossed – but to formalize preparation. Absent such efforts, we risk perpetuating an inequitable landscape in which only the informally trained achieve visibility, while others remain under-amplified despite comparable conviction. A coordinated educational response will ensure that future cohorts enter the field with passion, demonstrable proficiency, adaptive awareness, and a shared vocabulary of practice.
In this light, the institutionalization of dissent will align existing educational pathways with an already normalized mode of civic engagement, and, in doing so, quietly resolve the longstanding gap between expression and employability.
ai, education, parody, politics, technology
2 Comments