Why Rating Systems Sometimes Work
Posted by Bill Storage in Multidisciplinarians on August 22, 2012
Goodfilms is a Melbourne based startup that aims to do a better job of recommending movies to you. Their system uses your social network, e.g., Facebook, to show you what your friends are watching, along with two attributes of films, which you rate on a 10 scale (1 to 5 stars in half-star increments). It doesn’t appear that they include a personalized recommendation system based on collaborative filtering or similar.
In today’s Goodfilms blog post, Why Ratings Systems Don’t Work, the authors point to an XKCD cartoon identifying one of the many problems with collecting ratings from users.

The Goodfilms team says the problem with averaged rating values is that they attempt to distil an entire product down to a scalar value; that is, a number along a scale from 1 to some maximum imaginable goodness. They also suggest that histograms aren’t useful, asking how seeing the distribution of ratings for a film might possibly help you judge whether you’d like it.
Goodfilms demonstrates the point using three futuristic films, Blade Runner, Starship Troopers, and Fifth Element. The Goodfilms data shows bimodal distributions for all three films; the lowest number of ratings for each film is 2, 3, or 4 stars with 1 star and 5 stars having more votes.
Goodfilms goes on to say that their system gives you better guidance. Their film-quality visualization – rather than a star bar-chart and histogram – is a two axis scatter plot of the two attributes you rate for films on their site – quality and rewatchability, how much you’d like to watch that film again.
 An astute engineer or economist might note that Goodfilms assumes quality and rewatchability to be independent variables, but they clearly are not. The relationship between the two attributes is complex and may vary greatly between film watchers. Regardless of the details of how those two variables interact, they are not independent; few viewers would rate something low in quality and high in rewatchability.
But even if these attributes were independent of each other, films have many other attributes that might be more telling – length, realism, character development, skin exposure, originality, clarity of intent, provocation, explosion count, and an endless list of others. Even if you included 100 such variables (and had a magic visualization tool for such data), you might not capture the sentiment of a crowd of viewers about the film, let alone be able to decide whether you would like it based on that data. Now if you had some deep knowledge of how you, as an individual, compare, in aesthetics, values and mental process, to your Facebook friends and to a larger population of viewers – then we’d really know something, but that kind of analysis is still some distance out.
Goodfilms is correct in concluding that rating systems have their perils; but their solution, while perhaps a step in the right direction, is naive. The problem with rating systems is not that they don’t capture enough attributes of the rated product or in their presentation of results. The problem lies in soft things. Rating systems tend to deal more with attributes of products than with attributes of raters of those products. Recommendation systems don’t account for social influence well at all. And there’s the matter of actual preferences versus stated preference; we sometimes lie about what we like, even to ourselves.
Social influence, as I’ve noted in past posts, is profound, yet its sources can be difficult to isolate. In rating systems, knowledge of how peers or a broader population have rated what you’re about to rate strongly influence the outcome of ratings. Experiments by Salganik and others on this (discussed in this post) are truly mind boggling, showing that weak information about group sentiment not only exaggerates preferences but greatly destabilizes the system.
The Goodfilms data shows bimodal distributions for all three films. The 1 star and 5 star vote count is higher than the minimum count of the 2, 3, and 4 star rating counts. Interestingly, this is much less true for Imdb’s data. So what’s the difference? Goodfilms’ rating counts for these movies range from about 900 to 1800. Imdb has hundreds of thousands of votes for these films.
 As described in a previous post (Wisdom and Madness of the Yelp Crowd), many ratings sites for various products have bimodal distributions when rating count is low, but more normally distributed votes as the count increases. It may be that the first people who rate feel the need to exaggerate their preferences to be heard. Any sentiment above middle might gets cast as 5 star, otherwise it’s 1 star. As more votes are cast, one of these extremes becomes dominant and attracts voters. Now just one vote in a crowd, those who rate later aren’t compelled to be extreme, yet are influenced by their knowledge of how others voted. This still results in exaggeration of group preferences (data is left or right skewed) through the psychological pressure to conform, but eliminates the bimodal distribution seen in the early phase of rating for a given product. There is also a tendency at Imdb for a film to be rated higher when it’s new than a year later. Bias originating in suggestion from experts surely plays a role in this too; advertising works.
In the Imdb data, we see a tiny bit bimodality. The number of “1” ratings is only slightly higher that the number of “2” ratings (1-10 scale). Based on Imdb data, all three movies are all better than average – “average” being not 5.5 (halfway between 1 and 10) but either 6.2, the mean Imdb rating, or 6.4, if you prefer the median.
Imdb publishes the breakdown of ratings based on gender and age (Blade Runner, Starship Troopers, Fifth Element). Starship Troopers has considerably more variation between ratings of those under 18 and those over 30 than do the other two films. Blade Runner is liked more by older audiences than younger ones. That those two facts aren’t surprising suggests that we should be able to do better than recommending products based only on what our friends like (unless you will like something because your friends like it) or based on simple collaborative filtering algorithms (you’ll like it because others who like what you like liked it).

Imdb rating count vs. rating for 3 movies
So far, attempts to predict preferences across categories – furniture you’ll like based on your music preferences – have been rather disastrous. But movie rating systems actually do work. Yes, there are a few gray sheep, who lack preference similarity with the rest of users, but compared to many things, movies are very predictable – if you adjust for rating bias. Without knowledge that Imdb ratings are biased toward good and toward new, you high think a film with an average rating of 6 is better than average, but it isn’t, according to the Imdb community. They rate high.
Algorithms can handle that minor obstacle, even when the bias toward high varies between raters. With minor tweaks of textbook filtering algorithms, I’ve gotten movie predictions to be accurate within about half a star of actual. I tested this by using the movielens database and removing one rating from each users’ data and then making predictions for the missing movie for each user, then averaging the difference between predicted and actual values. Movie preferences are very predictable. You’re likely to give a film the same rating whether you saw it yesterday or today. And you’re likely to continue liking things liked by those whose taste was similar to yours in the past.
Restaurants are slightly less predictable, but still pretty good. Yesterday the restaurant was empty and you went for an early dinner. Today, you might get seated next to a loud retirement party and get a bad waiter. Same food, but your experience would color your subjective evaluation of food quality and come out in your rating.
Predicting who you should date or whether you’d like an autumn vacation in Paris is going to require a much different approach. Predicting that you’d like Paris based on movie tastes is ludicrous. There’s no reason to expect that to work other than Silicon Valley’s exuberant AI hype. That sort of prediction capability is probably within reach. But it will require a combination of smart filtering techniques (imputation-boosting, dimensionality reduction, hybrid clustering), taxonomy-driven computation, and a whole lot more context.
 Context? – you ask. How does my GPS position affect my dating preferences? Well that one should be obvious. On the dating survey, you said you love ballet, but you were in a bowling alley four nights last week. You might want to sign up for the mixed league bowling. But what about dining preferences? To really see where this is going you need to expand your definition of context (I’m guessing Robert Scoble and Shel Israel have such an expanded view of context based on the draft TOC for their upcoming Age of Context).
My expanded view of context for food recommendations would include location and whatever physical sensor info I can get, along with “soft” data like your stated preferences, your dining history and other previous activities, food restrictions, and your interactions with your social network. I might conclude that you like pork ribs, based on the fact that you checked-in 30 times this year at a joint that serves little else. But you never go there for lunch with Bob, who seems to be a vegetarian based on his lunch check-ins. Bob isn’t with you today (based on both of your geo data), you haven’t been to Roy’s Ribs in two weeks, and it’s only a mile away. Further, I see that you’re trying to limit carbohydrates, so I’ll suggest you have the salad instead of fries with those ribs. That is, unless I know what you’ve eaten this week and see that you’re well below your expected carb intake, in which case I might recommend the baked potato since you’re also minding your sodium levels. And tomorrow you might want to try the Hủ Tiếu Mì at the Vietnamese place down the road because people who share your preferences and restrictions tend to like Vietnamese pork stew. Jill’s been there twice lately. She’s single, and in the bowling league, and she rates Blade Runner a 10.
Paul Feyerabend – The Worst Enemy of Science
Posted by Bill Storage in Philosophy of Science on August 7, 2012
The Incommensurable Thomas Kuhn
Posted by Bill Storage in Philosophy of Science on August 4, 2012

William Storage 4 Aug 2012
Visiting Scholar, UC Berkeley Center for Science, Technology & Society
Thomas Kuhn’s 1962 book, The Structure of Scientific Revolutions, appears in Wikipedia’s list of the 100 most influential books in history. In Structure, Kuhn introduced the now ubiquitous term and concept of paradigm shift. As Kuhn saw it, the scope of a paradigm was universal. A paradigm is not merely a theory, but the framework and worldview in which a theory dwells. Kuhn explained that, “successive transition from one paradigm to another via revolution is the usual developmental pattern of mature science.” His view was that paradigms guide research through periods of “normal science,” during which, any experimental results not consistent with the paradigm are deemed erratic and are discarded. This persists until overwhelming evidence against the paradigm results in its collapse, and a paradigm shift occurs.
Kuhn stressed the idea of incommensurability between associated paradigms, meaning that it is impossible to understand the new paradigm from within the conceptual framework of its predecessor. Examples include the Copernican Revolution, plate tectonics, and quantum mechanics.
Countless discussions and critiques of Kuhn and his work have been published. I’ll focus mainly on aspects of his work – and popular conceptions of it – related to its appropriation in technology and business process management; but a bit of background on popular misunderstandings of his work from a philosophy perspective will come in handy later.
Kuhn’s claim of incommensurability led many to conclude that the selection of a governing theory is fundamentally irrational, a product of consensus or politics rather than of objective criteria. This fueled flames already raging in criticism of science in postmodernist, subjectivist, and post-structuralist circles. Kuhn was an overnight sensation and placed on a pedestal by all sorts of relativism, sociology, and arts and humanities movements, despite his vigorous rejection of them, their methods, their theories, and their paradigms. Decades later (The Road Since Structure), Kuhn added that, “if it was relativism, it was an interesting sort of relativism that needed to be thought out before the tag was applied.”
Communities outside of hard science – 20th century social theory in particular – couldn’t get enough of Kuhn and his paradigm shifts. Much of the Philosophy of Science community scoffed at his book. Within hard science there was considerable debate, particularly by Karl Popper, Stephen Toulmin and Paul Feyerabend. And even in the hard science community, Kuhn found himself in constant defense not against the scientific reading of his model, but against the ideas appropriated by schools of philosophers, cultural theorists, and literary critics calling themselves Kuhnians. Freeman Dyson recall s having confronted Kuhn about these schools of thought:
“A few years ago I happened to meet Kuhn at a scientific meeting and complained to him about the nonsense that had been attached to his name. He reacted angrily. In a voice loud enough to be heard by everyone in the hall, he shouted, ‘One thing you have to understand. I am not a Kuhnian.'” – Freeman Dyson, The Sun, The Genome, and The Internet: Tools of Scientific Revolutions
 Postmodern deconstructionists are certainly right about one thing; there are many ways to read Kuhn. Kuhn’s Structure – if interpreted outside the narrow realm in which he intended it to operate – becomes strangely self-referential and self-exemplifying. Different communities consumed it as constrained by their existing paradigms. In The Road Since Structure Kuhn reflected that, regarding Structure‘s uptake, he had disappointments but not regrets. He suggested that if he had it do over, he would have sought to prevent readings such as the view that paradigms are sources of oppression to be destroyed.
Kuhn would have to have been extremely naive to fail to consider the consequences – in the socially precarious 1960s – of describing scientific change in terms of a sociological, political, and Gestalt-psychology models in a book having “revolution” in its title. Or perhaps it was a scientist’s humility (he was educated as a physicist) that allowed him to not anticipate that a book on history of science would ever be read outside the communities of science. Despite the incredulity of such claims – and independent of accuracy of his position on science – my reading of Kuhn’s interviews and commentary on the impact of Structure leads me to conclude that Kuhn is truly an accidental guru – misread, misunderstood, and misused by adoring postmodernist theorists and business strategists alike. Without Thomas Kuhn, paradigm shift would not rank in CNET’s top 10 dot-com buzzwords, futurist Joel Barker and motivator Stephen Covey would have had very different careers, and postmodern relativists might still be desperately craving some shred of external validation.
——————————
.
“You talk about misuses of Kuhn’s work. I think it is wildly misused outside of natural sciences. The number of scientific revolutions is extremely small… To find one outside the natural sciences is very hard. There are just not enough interesting and signficant ideas around, but it is curious if you read the sociological or linguistic literate, that people are finding revolutions everywhere.” – Noam Chomsky, The Generative Enterprise Revisited
“Let us now turn our atention towards some historical analyses that have apparently provided grist for the mill of contemporary relativism. The most famous of these is undoubtedly Thomas Kuhn’s The Structure of Scientific Revolutions.” – Alan Sokol, Beyond the Hoax
——————————
The above use of a low-resolution image of Thomas Kuhn is contended to be a fair use because it is solely for the educational purpose of illustrating this article and because the value of any existing copyright is not lessened by its use here. The subject is deceased and no free equivalent can therefore be obtained. The image is of greatly lower quality than the original, reducing the risk of damage to the value of the original version.Dislodged Systems Engineers
Posted by Bill Storage in Engineering & Applied Physics, Multidisciplinarians on July 17, 2012
When I mostly dislodged myself from aerospace a while back and became mostly embedded in Silicon Valley, I was surprised by the undisciplined use of the term “Systems Engineer.”
To me, Systems Engineering was a fairly concise term for an interdisciplinary approach to design and construct successful systems. Systems Engineering – as seen by INCOSE, the International Council on Systems Engineering – involves translating customer needs into requirements, then proceeding with design synthesis. This process integrates many disciplines and specialty groups into a team effort to transform concept into design, production and operation. Systems Engineering accommodates business, technical and regulatory needs and requirements toward the goal of providing a quality product that makes investors, customers, regulators and insurers happy. It’s a methodical, top-down, big-picture approach.
In Silicon Valley, “systems engineering” is usually short for “embedded–systems engineering,” i.e., the engineering of embedded systems. An embedded system is usually a computer system that performs specific control functions, often within a larger system – like those designed by systems engineers as described above. Embedded systems get their name by being completely contained within a physical (hardware) device. Embedded systems typically contain microcontrollers or digital signal processors for a particular task within the device. A common form of embedded system is the firmware that provides the logic for your smart phone.
 There is often overlap. Aircraft, hospitals and irrigation management networks are all proper systems. And they contain many devices with embedded systems. Systems engineers need to have a cursory knowledge of what embedded-systems engineers do, and often detailed knowledge of the requirements for embedded systems. It’s a rare Systems Engineer who also does well at detailed design of embedded systems (Ron Bax at Crane Hydro-Aire take a bow). And vice versa. Designers of embedded systems usually only deal with a subset of the fundamentals of systems engineering – business problem statement, formulation of alternatives (trade studies), system modeling, integration, prototyping, performance assessment, reevaluation and iteration on these steps.
Because there are a lot more embedded-systems engineers than systems engineers in Silicon Valley, its residents are happy with dropping the “embedded” part, probably not realizing that doing so would make it hard for a systems engineer to find consulting work. Or perhaps “embedded” seems superfluous if you don’t know about the discipline of systems engineering at all. This is a shame, since a lot of firms who make things with embedded systems could use a bit – perhaps quite a bit – of systems engineering perspective.
This is an appeal for more discipline in the semantics of engineering (call me a pedantic windbag – my wife does) and for awareness of the discipline of Systems Engineering. Systems Engineering is a thing and the world could use more of it. Silicon Valley firms would benefit from the methodical, big-picture perspective of Systems Engineering by better transforming concept to design and design to product. Their investors would like it too.
—————————————————-
Tangent:
In my work as a software engineer – not of the embedded sort – I’ve spent some time with various aspects of semantics and linguistics – forensic linguistics being the most fun. “Embedded” in linguistics refers to a phrase contained in a phrase of the same type. This makes for very difficult machine – and often human – parsing. Humans have little trouble with single embedding but struggle with double embedding. Triple embedding, though it appeared in ancient writing, sends modern humans running for the reboot switch. The ancient Romans were far more adept at parsing such sentences than we are today, though their language was more suited to it.
The child the dog bit got rabies shots. The child the dog the man shot bit got rabies shots. The child the dog the man the owner sued shot bit got rabies shots.
My wife is probably right.
Spurious Regression
Posted by Bill Storage in Design Thinking, Multidisciplinarians on June 14, 2012
William Storage 14 Jun 2012
Visiting Scholar, UC Berkeley Center for Science, Technology, Medicine & Society
I’ve been looking into the range of usage of the term “Design Thinking” (see previous post on this subject) on the web along with its rate of appearance in publications. According to Google, the term first appeared in print in 1973, occurring occasionally until 1988. Over the next five years its usage increased ten-fold, then calming down a bit. It peaked again in 2003 and has declined a bit since then.
 Rate of appearance of “Design Thinking” in publications
since 1970 (bottom horizontal is zero) per Google.
More interesting than term publication rates was the Google data on search requests. I happened upon a strong correlation between Google searches for “Design Thinking” and both “Bible verse” and “scriptures.” That is, the rate of Google searches for Design Thinking rise and fall in sync with searches for Bible verses.
A scatter plot of search activity for Design Thinking and Bible verse from 2005 to present shows an uncanny correlation:

US web search activity for Design Thinking and Bible verse (r=0.9648) Source: Google Correlate
From this, we might conclude that Design Thinking is a religion or that holism is central to both Christianity and Design Thinking. Or that studying Design Thinking causes interest in scriptures or vice versa. While at least one of these four possibilities is in fact true (Christianity and Design Thinking both rely on holism), we would be very wrong to think the relationship between search behavior on these terms to be causal.
A closer look at the Design Thinking – Bible verse data, this time as a line plot, over a few years is telling. Searches for the both terms hit a yearly minimum the last week of December and another local minimum near mid-July. It would seem that time of year has something do with searching on both terms.

Google Correlate relative rates of searches on Design Thinking
and Bible verse, July 09-July 2011 (r=0.964)
If two sets of data, A and B, correlate, there are four possibilities to explain the correlation:
1. A causes B
2. B causes A
3. C causes both A and B
4. The correlation is merely coincidental
Item 3, known as the hidden variable or ignoring a common cause, is standard fare for politics and TV news (imagine what Fox News or NPR might do with the Design Thinking – Bible verse correlation). But in statistics, spurious correlations are bad news.
Spurious regression is the term for the scenario above. In this linear regression model, A was regressed on B. But there is some unknown C probably having to do with seasonal interest/disinterest due to time availability or more pressing topics of interest. Searches on Broncos and Tebow, for example, have negative correlations with Design Thinking and Bible verse.
Watch for tomorrow’s piece on Politics Thinking and Journalism Thinking.

Wind Science Fluttering in the Breeze
Posted by Bill Storage in Engineering & Applied Physics, Sustainable Energy on June 6, 2012
 Three years ago Inc magazine praised a recently-funded startup called WindTronics. Their energy claims for their $5500 rooftop wind turbine seemed so absurd that I suspected Inc had botched the technical details. Since then I’ve followed the Michigan firm. Their rooftop wind turbine was awarded “Best of What’s New” by Popular Science magazine last November. It was called “one of the 10 most brilliant products of 2009” by Popular Mechanics. In 2009 they moved their production to Ontario. They recently closed operations in Ontario and moved back to Michigan. Reports say Canadians aren’t happy about the $2.7 million Canada gave the company as an incentive to set up operations there. The Windsor Star reports that WindTronics left without making good on its debts.
There may be two sides to the financial issues; I didn’t dig very deep. The technical claims, however, are another matter. Some basic analysis reveals big problems with the claims.
Windtronics make a 6-foot diameter rooftop wind turbine. They claimed the device could supply 18% of an average household’s electricity, based on a 12.8 mph wind speed. Without knowing a thing about their technology, it’s very easy to debunk this. They also claim it generates power down to a wind speed of two miles per hour. This is true, but highly deceptive.
The wind in Chicago, the windy city, averages about 10 mph. Kinetic energy is equal to ½ the mass of the moving matter times its velocity squared. So wind energy extracted from moving air – if you could catch it all – would be proportional to the square of the wind speed. Cut the speed in half and you end up with one fourth of the energy. – You’d cut the ideal maximum by 75 percent, assuming the turbine were equally efficient at both wind speeds – which is impossible. At two mph wind speed, the maximum theoretical power would be 4% of the power at 10 mph. But a few more details will show it to be even far less than that.
Large modern wind turbines have an efficiency of about 40%, but they reach this maximum at the specific wind speed for which they were designed. The efficiency is constrained by frictional losses at low speeds and back pressure (the “lift” that makes an aircraft fly) on the blades above the design speed. Above or below the optimum wind speed, efficiency drops off steeply. For example, at twice their design wind speed, the efficiency of commercial wind turbines drops to about 10%.
Betz’ Law, a principle of hydraulics, shows that the maximum energy that a turbine of any design can extract from such a wind turbine is exactly 16/27 (~59%) of the kinetic energy of wind. The Windtronics machine is six feet in diameter. Assuming its blades go to the very outer diameter of their housing, its wind area is 28 square feet. Using average air pressure, temperature and humidity and a Rayleigh distribution of wind speed, one can then calculate the energy in a 6-foot diameter tube of air moving at 12.8 miles per hour. 59% of that will be the maximum possible energy that the Windtronics machine could produce if it were a perfect machine. That equates to 2000 kWh per year. But that value is for a machine that is frictionless.
At an optimistic efficiency of 50% and a wind velocity of 6.5 miles per hour, the calculated yearly output of the WindTronics turbine is 404 kWh, which is about 4.0% of the average household’s electrical usage, based on Department of Energy usage numbers.
Also per the DOE, the average cost of residential electricity in the United States was (and still is) 12 cents per kWh when WindTronics released their turbine. The average household uses 11,000 kWh per year, and therefore, pays about $1300 for all their electricity. If the rooftop turbine supplies 4% of that and costs $5500, you could amortize your purchase in a mere 100 years, assuming your installation costs are zero and the unit lasts a century without maintenance.
Consumer Reports evaluated the turbine in October 2011 and reported an installation cost of about $11,000. They said they got only a fraction of the power WindTronics told them to expect and noted that it would not pay for itself in its expected 20-year life. My quick analysis suggests they put it mildly.
Windtronics explains the magic of their gizmo:
Our wind turbine utilizes a system of magnets and stators surrounding its outer ring, capturing power at the blade tips where speed is greatest, practically eliminating mechanical resistance and drag. Rather than forcing the available wind to turn a generator, the perimeter power system becomes the generator by swiftly passing the blade tip magnets through the copper coil banks mounted onto the enclosed perimeter frame.
While there’s nothing actually false in those words, they seem to aim at baffling more than illuminating. Elegant words whose meaning is lost somewhere in a vast windswept expanse.
Collective Decisions and Social Influence
Posted by Bill Storage in Crowd wisdom, Multidisciplinarians on April 26, 2012
 People have practiced collective decision-making here and there since antiquity. Many see modern social connectedness as offering great new possibilities for the concept. I agree, with a few giant caveats. I’m fond of the topic because I do some work in the field and because it is multidisciplinary, standing at the intersection of technology and society. I’ve written a couple of recent posts on related topics. A lawyer friend emailed me to say she was interested in my recent post on Yelp and crowd wisdom. She said the color-coded scatter plots were pretty; but she wondered if I had a version with less whereas and more therefore. I’ll do that here and give some high points from some excellent studies I’ve read on the topic.
First, in my post on the Yelp data, I accepted that many studies have shown that crowds can be wise. When large random crowds respond individually to certain quantitative questions, the median or geometric mean (though not the mean value) is often more accurate than answers by panels of experts. This requires that crowd members know at least a little something about the matter they’re voting on.
Then my experiments with Yelp data confirmed what others found in more detailed studies of similar data:
- Yelp raters tend to give extreme ratings.
- Ratings are skewed toward the high end.
- Even a rater who rates high on average still rates many businesses very low.
- Many businesses in certain categories have bimodal distributions – few average ratings, many high and low ratings.
- Young businesses are more like to show bimodal distributions; established ones right-skewed.
I noted that these characteristics would reduce statisticians’ confidence in conclusions drawn from the data. I then speculated that social influence contributed to these characteristics of the data, also seen in detailed studies published on Amazon, Imdb and other high-volume sites. Some of those studies actually quantified social influence.
Two of my favorite studies show how mild social influence can damage crowd wisdom; and how a bit more can destroy it altogether. Both studies are beautiful examples of design of experiments and analysis of data.
In one (Lorenz, et. al., full citation below), the experimenters asked six questions to twelve groups of twelve students. In half the groups, people answered questions with no knowledge of the other members’ responses. In the other groups the experimenters reported information on the group’s responses to all twelve people in that group. Each member in such groups could then give new answers. They repeated the process five times allowing each member to revise and re-revise his response with knowledge about his group’s answers, and did statistical analyses on the results. The results showed that while the groups were initially wise, knowledge about the answers of others narrowed the range of answers. But this reduced range did not reduce collective error. This convergence is often called the social influence effect.
A related aspect of the change in a group’s answers might be termed the range reduction effect. It describes that fact that the correct answer moves progressively toward the periphery of the ordered group of answers as members revise their answers. A key consequence of this effect is that representatives of the crowd become less valuable in giving advice to external observers.
The most fascinating aspect of this study was the confidence effect. Communication of responses by other members of a group increased individual members’ confidence about their responses during convergence of their estimates – despite no increase in accuracy. One needn’t reach far to find examples in the form of unfounded guru status, overconfident but misled elitists, and Teflon financial advisors.
Another favorite of the many studies quantifying social influence (Salganik, et. al.) built a music site where visitors could listen to previously-unreleased songs and download them. Visitors were randomly placed in one of eight isolated groups. All groups listened to songs, rated them, and were allowed to download a copy. In some of the groups visitors could see a download count of each song, though this information was not emphasized. The download count, where present, was a weak indicator of the preferences of other visitors. Ratings from groups with no download count information yielded a measurement of song quality as judged by a large population (14,000 participants total). Behavior of the groups with visible download counts allowed the experimenters to quantify the effect of mild social influence.
The results of the music experiment were profound. It showed that mild social influence contributes greatly to inequality of outcomes in the music market. More importantly, it showed, by comparison of the isolated populations that could see download count, that social influence introduces instability and unpredictability in the results. That is, wildly different “hits” emerged in the identical groups when social influence was possible. In an identical parallel universe, Rihanna did just OK and Donnie Darko packed theaters for months.
Engineers and mathematicians might correctly see this instability situation as something like a third order dynamic system, highly sensitive to initial conditions. The first vote cast in each group was the flapping of the butterfly’s wings in Brazil that set off a tornado in Texas.
This study’s authors point out the ramifications of their work on our thoughts about popular success. Hit songs, top movies and superstars are orders of magnitude more successful than their peers. This leads to the sentiment that superstars are fundamentally different from the rest. Yet the study’s results show that success was weakly related to quality. The best songs were rarely unpopular; and the worst rarely were hits. Beyond that, anything could and did happen.
This probably explains why profit-motivated experts do so poorly at predicting which products will succeed, even minutes before a superstar emerges.
When information about a group is available, its members do not make decisions independently, but are influenced subtly or strongly by their peers. When more group information is present (stronger social influence), collective results become increasingly skewed and increasingly unpredictable.
The wisdom of crowds comes from aggregation of independent input. It is a matter of statistics, not of social psychology. This crucial fact seems to be missed by many of the most distinguished champions of crowdsourcing, collective wisdom, crowd-based-design and the like. Collective wisdom can be put to great use in crowdsourcing and collective decision making. The wisdom of crowds is real, and so is social influence; both can be immensely useful. Mixing the two makes a lot of sense in the many business cases where you seek bias and non-individualistic preferences, such as promoting consumer sales.
But extracting “truth” from a crowd is another matter – still entirely possible, in some situations, under controlled conditions. But in other situations, we’re left with the dilemma of encouraging information exchange while maintaining diversity, independence, and individuality. Too much social influence (which could be quite a small amount) in certain collective decisions about governance and the path forward might result in our arriving at a shocking place and having no idea how we got there. History provides some uncomfortable examples.
_______________
Sources cited:
Jan Lorenza, Heiko Rauhutb, Frank Schweitzera, and Dirk Helbing. “How social influence can undermine the wisdom of crowd effect” Proceedings of the National Acadamy of Science, May 31 2011.
Matthew J. Salganik, Peter Sheridan Dodds et. al. “Experimental Study of Inequality and Unpredictability in an Artificial Cultural Market,” Science Feb 10 2006.
Wisdom and Madness of the Yelp Crowd
Posted by Bill Storage in Crowd wisdom, Multidisciplinarians, Probability and Risk on April 20, 2012
 I’ve been digging deep into Yelp and other sites that collect crowd ratings lately; and I’ve discovered wondrous and fascinating things. I’ve been doing this to learn more about when and how crowds are wise. Potential inferences about “why” are alluring too. I looked at two main groups of reviews, those for doctors and medical services, and reviews for restaurants and entertainment.
As doctors, dentists and those in certain other service categories are painfully aware, Yelp ratings do not follow the expected distribution of values. This remains true despite Yelp’s valiant efforts to weed out shills, irate one-offs and spam.
Just how skewed are Yelp ratings when viewed in the aggregate? I took a fairly deep look and concluded that big bias lurks in the big data of Yelp. I’ll get to some hard numbers and take a crack at some analysis. First a bit of background.
Yelp data comes from a very non-random sample of a population. One likely source of this adverse selection is that those who are generally satisfied with service tend not to write reviews. Many who choose to write reviews want their ratings to be important, so they tend to avoid ratings near the mean value. Another source of selection bias stems from Yelp’s huge barrier – in polling terms anyway – to voting. Yelp users have to write a review before they can rate, and most users can’t be bothered. Further, those who vote are Yelp members who have (hopefully) already used the product or service, which means there’s a good chance they read other reviews before writing theirs. This brings up the matter of independence of members.
Plenty of tests – starting with Francis Galton’s famous ox-weighing study in 1906 – have shown that the median value of answers to quantitative questions in a large random crowd is often more accurate than answers by panels of experts. Crowds do very well at judging the number of jellybeans in the jar and reasonably well at guessing the population of Sweden, the latter if you take the median value rather than the mean. But gross misapplications of this knowledge permeate the social web. Fans of James Surowiecki’s “The Wisdom of Crowds” very often forget that independence is essential condition of crowd wisdom. Without that essential component to crowd wisdom, crowds can do things like burning witches and running up stock prices during the dot com craze. Surowiecki acknowledges the importance of this from the start (page 5):
There are two lessons to be drawn from the experiments. In most of them the members of the group were not talking to each other or working on a problem together.
Influence and communication love connections; but crowd wisdom relies on independence of its members, not collaboration between them. Surowiecki also admits, though rather reluctantly, that crowds do best in a subset of what he calls cognition problems – specifically, objective questions with quantitative answers. Surowiecki has great hope for use of crowds in subjective cognition problems along with coordination and cooperation problems. I appreciate his optimism, but don’t find his case for these very convincing.
In Yelp ratings, the question being answered is far from objective, despite the discrete star ratings. Subjective questions (quality of service) cannot be made objective by constraining answers to numerical values. Further, there is no agreement on what quality is really being measured. For doctors, some users rate bedside manner, some the front desk, some the outcome of ailment, and some billing and insurance handling. Combine that with self-selection bias and non-independence of users and the wisdom of the crowd – if present – can have difficulty expressing itself.
Two doctors on my block have mean Yelp ratings of 3.7 and 3.0 stars on a scale of 1 to 5. Their sample standard deviations are 1.7 and 1.9 (mean absolute deviations: 1.2 and 1.8). Since the maximum possible population standard deviation for a doctor on Yelp is 2.0, everything about this doctor data should probably be considered next to useless; it’s mean and even median aren’t reliable. The distributions of ratings isn’t merely skewed; it’s bimodal in these two cases and for half of the doctors in San Francisco. That means the rating survey yields highly conflicting results for doctors. Here are the Yelp scores of doctors in my neighborhood.
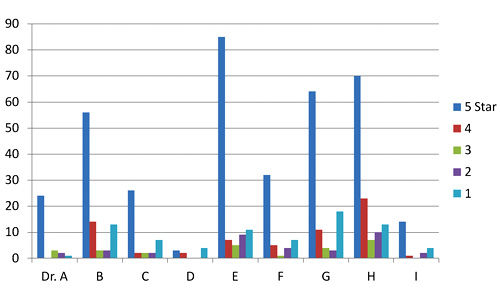
Yelp rating distribution for 9 nearby doctors
I’ve been watching the doctor ratings over the last few years. A year ago, Dr. E’s ratings looked rather like Dr. I’s ratings look today. Unlike restaurants, which experience a rating warm-start on Yelp, the 5-star ratings of doctors grow over time at a higher rate than their low ratings. Doctors, some having been in business for decades, appear to get better as Yelp gets more popular. Three possible explanations come to mind. The first deals with competition. The population of doctors, like any provider in a capitalist system, is not fixed. Those who fare poorly in ratings are likely to get fewer customers and go out of business. The crowd selects doctors for quality, so in a mature system, most doctors, restaurants, and other businesses will have above-average ratings.
The second possible explanation for the change in ratings over time deals with selection, not in the statistics sense (not adverse selection) but in the social-psychology sense (clan or community formation). This would seem more likely to apply to restaurants than to doctors, but the effect on urban doctors may still be large. People tend to select friends or communities of people like themselves – ethnic, cultural, political, or otherwise. Referrals by satisfied customers tend to bring in more customers who are more likely to be satisfied. Businesses end up catering to the preferences of a group, which pre-selects customers more likely to be satisfied and give high ratings.
A third reason for the change over time could be a social-influence effect. People may form expectations based on the dominant mood of reviews they read before their visit. So later reviews might greatly exaggerate any preferences visible in early reviews.
Automotive services don’t fare much better on Yelp than doctors and dentists. But rating distributions for music venues, hotels and restaurants, though skewed toward high ratings, aren’t bimodal like the doctor data. The two reasons given above for positive skew in doctors’ ratings are likely both at work in restaurants and hotels. Yelp ratings for restaurants give clues about those who contribute them.
 I examined about 10,000 of my favorite California restaurants, excluding fast food chains. I was surprised to find that the standard deviation of ratings for each restaurant increased – compared to theoretical maximum values – as average ratings increased. If that’s hard to follow in words, the below scatter plot will drive the point home. It shows average rating vs. standard deviation for each of 10,000 restaurants. Ratings are concentrated at the right side of the plot, and are clustered fairly near the theoretical maximum standard deviation (the gray elliptical arc enclosing the data points) for any given average rating. Color indicate rough total rating counts contributing to each spot on the plot – yellow for restaurants with 5 or less ratings, red for those having 40 or less, and blue for those with more than 40 ratings. (Some points are outside the ellipse because it represents maximum population deviations and the points are sample standard deviations.)
The second scatter shows average rating vs. standard deviation for the Yelp users who rated these restaurants, with the same color scheme. Similarly, it shows that most raters rate high on average, but each voter still tends to rate at the extreme ends possible to yield his average value. For example, many raters whose average rating is 4 stars use far more 3 and 5-star ratings than nature would expect.

Scatter plot of standard deviation vs. average Yelp rating for about 10,000 restaurants

Scatter plot of standard deviation vs. average rating for users who rated 10,000 restaurants
Next I looked at the rating behavior of users who rate restaurants. The first thing that jumps out of Yelp user data is that the vast majority of Yelp restaurant ratings are made by users who have rated only one to five restaurants. A very small number have rated more than twenty.

Rating counts of restaurant raters by activity level
A look at comparative distribution of the three activity levels (1 to 5, 6 to 20, and over 20) as percentages of category total shows that those who rate least are more much more likely to give extreme ratings. This is a considerable amount of bias, throughout 100,000 users making half a million ratings. In a 2009 study of Amazon users, Vassilis Kostakos found similar results in their ratings to what we’re seeing here for bay area restaurants.

Normalized rating counts of restaurant raters by activity level
Can any practical wisdom be applied to this observation of crowd bias? Perhaps a bit. For those choosing doctors based on reviews, we can suggest that doctors with low rating counts, having both very high and very low ratings, will likely look better a year from now. Restaurants with low rating counts (count of ratings, not value) are likely to be more average than their average rating values suggest (no negative connotation to average here). Yelp raters should refrain from hyperbole, especially in their early days of rating. Those putting up rating/review sites should be aware that seemingly small barriers to the process of rating may be important, since the vast majority of raters only rate a few items.
This data doesn’t really give much insight into the contribution of social influence to the crowd bias we see here. That fascinating and important topic is at the intersection of crowdsourcing and social technology. More on that next time.
Science, Holism and Easter
Posted by Bill Storage in Multidisciplinarians, Systems Thinking on April 8, 2012
 Thomas E. Woods, Jr., in How the Catholic Church Built Western Civilization, credits the church as being the primary sponsor of western science throughout most of the church’s existence. His point is valid, though many might find his presentation very economical with the truth. With a view that everything in the universe was interconnected, the church was content to ascribe the plague to sin. The church’s interest in science had something to do with Easter. I’ll get to that after a small diversion to relate this topic to one from a recent blog post.
Catholic theologians, right up until very recent times, have held a totally holistic view, seeing properties and attributes as belonging to high level objects and their context, and opposing reductionism and analysis by decomposition. In God’s universe (as they saw it), behavior of the parts was determined by the whole, not the other way around. Catholic holy men might well be seen as champions of “Systems Thinking” – at least in the popular modern use of that term. Like many systems thinking advocates in business and politics today, the church of the middle ages wasn’t merely pragmatic-anti-reductionist, it was philosophically anti-reductionist. I.e., their view was not that it is too difficult to analyze the inner workings of a thing to understand its properties, but that it is fundamentally impossible to do so.

Santa Maria degli Angeli, a Catholic solar observatory
Unlike modern anti-reductionists, whose movement has been from reductionism toward something variously called collectivism, pluralism or holism, the Vatican has been forced in the opposite direction. The Catholics were dragged kicking and screaming into the realm of reductionist science because one of their core values – throwing really big parties – demanded it.
The celebration date of Easter is based on pagan and Jewish antecedents. Many agricultural gods were celebrated on the vernal equinox. The celebration is also linked to Shavuot and Passover. This brings the lunar calendar into the mix. That means Easter is a movable feast; it doesn’t occur on a fixed day of the year. It can occur anywhere from March 22 to April 25. Roughly speaking, Easter is the first Sunday following the first full moon after the spring equinox. To mess things up further, the ecclesiastical definitions of equinox and full moon are not the astronomical ones. The church wades only so far into the sea of reductionism. Consequently, different sects have used different definitions over the years. Never fearful of conflict, factions invented nasty names for rival factions; and, as Socrates Scholasticus tells it, Bishop John Chrysostom booted some of his Easter-calculation opponents out of the early Catholic church.
 Science in the midst of faith, Santa Maria degli Angeli
By the 6th century, the papal authorities had legislated a calculation for Easter, enforcing it as if it came down on a tablet. By the twelfth century, they could no longer evade the fact that Easter had drifted way off course.
Right around that time, Muslim scholars had just translated the works of the ancient Greek mathematicians to Latin (Ptolemy’s Almagest in particular). By the time of the Renaissance, Easter celebrations in Rome were gigantic affairs. Travel arrangements and event catering meant that the popes needed to plan for Easter celebrations many years in advance. They wanted to send out invitations specifying a single date, not a five week range.
 Sketch from Bianchini’s 1703 “De nummo.”
Science appeared the only way to solve the messy problem of predicting Easter. And the popes happened to have money to throw at the problem. They suddenly became the world’s largest backer of scientific research – well, targeted research, one might say. John Heilbron, Vice-Chancellor Emeritus of UC Berkeley (who brought me into History of Science at Cal) put it this way in his The Sun in the Church:
The Roman Catholic Church gave more financial support to the study of astronomy for over six centuries, from the recovery of ancient learning during the late Middle Ages into the Enlightenment, than any other, and, probably, all other, institutions. Those who infer the Church’s attitude from its persecution of Galileo may be reassured to know that the basis of its generosity to astronomy was not a love of science but a problem of administration. The problem was establishing and promulgating the date of Easter.
The tough part of the calculation was determining the exact time of the equinox. Experimental measurement would require a large observatory with a small hole in the roof and a flat floor where one could draw a long north-south line to chart out the spot the sun hit on the floor at noon. The spots would trace a circuit around the floor of the observatory. When the spot returned to the same point on the north-south line, you had the crux of the Easter calculation.

 Solar observatory detail in marble floor of church
By luck or divine providence, the popes already had such observatories on hand – the grand churches of Europe. Punching a hole through the roof of God’s house was a small price to pay for predicting the date of Easter years in advance.
Fortunately for their descendants, scientists are prone to going off on tangents, some of which come in handy. They needed a few centuries of experimentation to perfect the Easter calculation. Matters of light diffraction and the distance from the center of the earth to the floor of the church had to be addressed. During this time Galileo and friends stumbled onto a few work byproducts that the church would have been happier without, and certainly would not have invested in.

Gnomon and meridian, Saint-Sulpice, Paris
The guy who finally mastered the Easter problem was Francesco Bianchini, multidisciplinarian par exellence. The church OK’d his plan to build a meridian line diagonally across the floor of the giant church of Santa Maria degli Angeli in Rome. This church owes its size to the fact that it was actually built as a bath during the reign of Diocletian (284 – 305 AD) and was then converted to a church by Pope Pius IV in 1560 with the assistance of Michelangelo. Pius set about to avenge Diocletian’s Christian victims by converting a part of the huge pagan structure built “for the convenience and pleasure of idolaters by an impious tyrant” to “a temple of the virgin.”
Bianchini’s meridian is a major point of tourist interest within Santa Maria degli Angeli. All that science in the middle of a church feels really odd – analysis surrounded by faith, reductionism surrounded by holy holism.
Management Initiatives and the Succession of Divine Generations
Posted by Bill Storage in Innovation management, Multidisciplinarians on March 26, 2012
 Yesterday I commented on how corporate managers tend to move on to new, more fashionable approaches, independent of the value of current ones. I played around with using models from religious studies for understanding rivalry in Systems Thinking. Several good books interpret the rapid rise and decline of management initiatives and business improvement methods from the perspective of management-as-fashion. As with yesterday’s topic I think the metaphor of business mindset as religion also helps understand the phenomenon. In the spirit of multidisciplinary study, I’ll kick this around a bit.
The fad nature of strategic management initiatives and business process improvement methodologies has been studied in depth over the past two decades. Managers rapidly acquire strong interest in a new approach to improvements in productivity or competitiveness and embrace the methodology with enthusiasm and commitment. The recent explosion of tech/business hype on the web, consumed by small business as well as large, seems to increase frequency and amplitude of business fashions. Often before metrics can be established to assess effectiveness, enthusiasm declines and the team becomes restless. Eyes wander and someone hears of new, even-stronger magic. Another cycle begins – and is exploited by high-priced consultants ready to help you deploy the next big thing. Cameron and Quinn, in Diagnosing and Changing Organizational Culture give a truly dismal report card to nearly all organizational change initiatives.
Each successive cycle increases the potential for cynicism and resentment, particularly for those not at the top. Barry Staw and Lisa Epstein of UC Berkeley showed a decade ago that bandwagon application of the TQMS (Total Quality Management System) initiative in the 1990s did not correlate with increased profits, but correlated very well with decline of employee morale and increases in CEO compensation. Quite a few top managers were highly rewarded for spearheading TQM but retired with honors before TQM’s effect (or lack of it) was known.

Google Ngram for TQM, ISO 9001 and Six Sigma over a 20-year period
The skepticism given TQM by many professionals was shown by a poster seen in many cubicles in those days. It contained a statement attributed to Petronius (incorrectly attributed to Petronius, probably derived from Robert Townsend’s Up the Organization!):
We trained hard but it seemed that every time we were beginning to form up into teams we would be reorganized. I was to learn later in life that we tend to meet any new situation by reorganizing; and a wonderful method it can be for creating the illusion of progress while producing confusion, inefficiency, and demoralization
Having been a consultant in those days, I was painfully aware of what the TQMS and ISO 9001 fads had done for how consultants were viewed by hard-working employees. The last data I’ve seen on use of consultants in strategic initiatives (Peter Wood, 2002) showed that most firms used outsiders to justify and implement such programs. In the management-fashion metaphor, consultants are both the key fashion suppliers and its advertisers, skilled at detecting and exploiting burgeoning sales opportunities.
In a little over twenty years of working with large corporations, I got to witness many process, quality, and management initiatives:
- Quality Circles
- STEP – Solutions Through Employee Participation
- IDEF0 – Integration Definition for Function Modeling
- McBer Competency Framework
- Keys to Self Renewal
- Continuous Improvement/Kaizen
- Natural Work Groups
- Statistical Process Control
- BWA – Business Workflow Analysis
- McKinsey consultation
- Kanban
- CPIP – Continuous Performance Improvement Program
- QFD – Quality function deployment
- Leadership Councils
- Matrix Management
- Integrated Product Development
- BPR – Business process reengineering
- SDWT – Self-Directed Work Teams
- Boothroyd Dewhurst DFMA – Design for Manufacture and Assembly
- Process-Based Management
- TQMS – Total Quality Management System
Three of these stand out – Statistical Process Control and DFMA, because, in their most technical interpretation at least, they produced measurable results; and TQMS, because it was embraced with unparalleled gusto but flopped miserably. Despite the negative views of these initiatives in the ranks, I have little reason to find fault with them; they may have all been successful in due time with due commitment. In general, it was the initiatives’ frequency that demoralized, much more than the content. Today’s business fads are less intrusive and less about the organization. But that could change.
In the TQMS years I was at Douglas Aircraft in Long Beach, then rival of Boeing in Seattle. Douglas employees, both wary and weary of TQMS, read the acronym as “Time to Quit and Move to Seattle.”
As a religious parallel, I’m interested in the way ancient religions grew tired of their gods and invented new, oddly equivalent ones to replace them. At some point the Egyptians seemed to feel that Amun-Ra’s power had faded, though he had replaced the withered Nun. Isis and Osiris took Amun-Ra’s place. In the Greek world Asclepius and Hercules/Melkart replaced the Olympian gods. In Rome Mithras replaced Helios, both solar deities. Divine succession may have something to do with the eventual realization that the gods failed to do man’s bidding. The ancients were perhaps a bit more patient than modern business is.
In the 1990s, corporate messianic expectation surged. Religious parallels abound in the TQM literature, e.g., Robert J Bird’s observations on Transitory Collective Beliefs and the Dynamics of TQM Consulting, in which he quotes a Business Forum article stating that TQM “will change our lives as much as the advent of mass production”. The long, slow route of continuous improvement wasn’t yielding fast enough. Leaders looked to consulting firms in the sky to deliver immediate bottom line salvation. When it didn’t materialize, a new generation of humbler, more earthly gods emerged. Agile, Scrum, Targeted Innovation, and the seven habits of highly effective business secularists.
Closely related to messianic expectation is the concept of sacred scapegoats (see René Girard and Raymund Schwager). In ancient times, when a tribe grew impatient with their king or priest, they threw him into a sacrificial pit, imagining that his sins, their sins, and the current bad times would go along for the ride. A new king was chosen and hopes for renewal were celebrated. Our New Year’s Eve parties retain a hint of this motif. Kings got wise to this risk and introduced the practice of delegating a mock king for a day, selecting some hapless victim/king from the prison. The mock king was both venerated and condemned, then went down the well with the collective sins of the tribe. The real king survived to usher in the new year.
Applying this model to continuous improvement dynamics, it may be that there’s more than mere fashion to the speed with which we replace business methodologies. Their adoption and dismissal might simply be part of a stable process of coming to terms with unrealized goals, unreasonable as they might have been in the first place, and throwing them down the pit.
———————————–
History does not repeat itself, but it does rhyme. – Mark Twain

